Tech Times Names EquityStat Best Investment Portfolio Management Software

Tech Times recently named EquityStat its best investment portfolio management software. They recognize EquityStat as the top choice for investors seeking effective portfolio management software, with its advanced features and user-friendly interface positioning it as a valuable tool for optimizing investment performance.

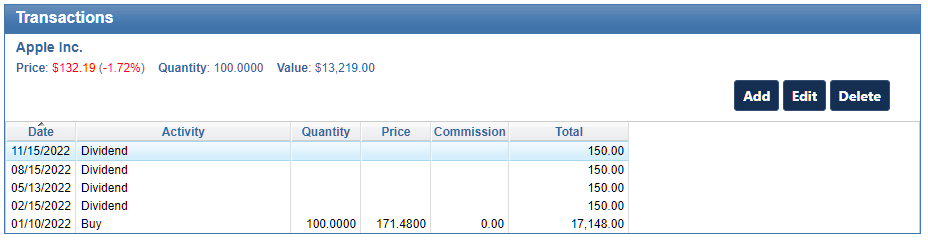
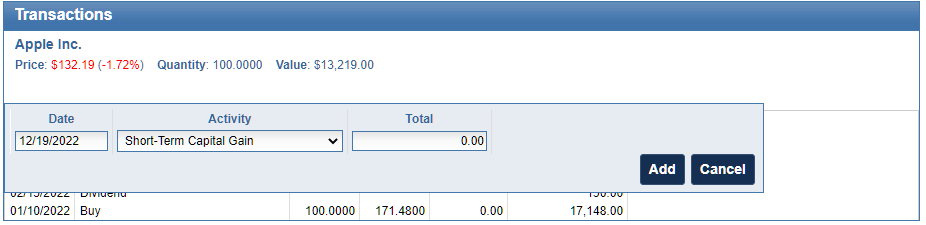
Tech Times praises EquityStat for its real-time data capabilities, performance tracking, and personalized portfolio analysis. EquityStat is also recognized for its user-friendly interface, making it suitable for investors of all experience levels.

EquityStat’s mission to empower investors through data-driven investing was a key focal point, emphasizing how the platform enables users to gain control over their investments and make smarter choices. The article also highlights the user-friendly interface, making it accessible for both seasoned investors and those new to the stock market.

The article concludes by emphasizing how EquityStat has successfully simplified the process of managing tech investments, making it an invaluable tool for tech enthusiasts, investors, and professionals alike.

You can read the entire article here.

https://www.techtimes.com/articles/294138/20230724/top-5-best-investment-portfolio-management-software-2023.htm

‘Tis the Season For Dividends and Capital Gains

It is that time of year when stocks and mutual funds pay their end of year dividends, short-term capital gains and long-term capital gains.

With EquityStat’s stock portfolio manager, it is easy to track and manage these dividends and capital gains.

If you have a stock or mutual fund that has paid a distribution, select the stock in your portfolio. Then in the transactions panel, click the Add button to add a new transaction.

Add dividend, short-term capital gains and long-term capital gains to your EquityStat stock portfolio.
Transaction Panel Example

Next, select whether you were paid a dividend, short-term capital gain or long-term capital gain from the Activity drop down. If you re-invest your dividends and capital gains, then you can select re-invested dividends, re-invested short-term gains, or re-invested long-term gains from the Activity drop down.

Once you have selected your distribution type, enter the rest of your dividend information and click the Add button.

Add dividend, short-term capital gains and long-term capital gains to your EquityStat stock portfolio.
Example of entering a short-term capital gain.

There are a couple of ways to track your dividends. For each stock you can display the amount of dividends (including short-term and long-term capital gains) the stock has paid. To display this metric, click the Options menu at the top and choose the Change Columns option from the drop down menu. Then add the Total Dividends to the list of displayed columns.

The analyze portfolio page also displays the amount of dividends paid (this includes short-term and long-term capital gains) over a period of time for your entire account or for a specific portfolio. To view the analyze portfolio page, click the Tools menu at the top and choose Analyze Portfolio option from the drop down menu.

How to import your Google Finance Portfolio into EquityStat

As you know, Google Finance is discontinuing their portfolio manager.  If you are looking for an alternative you can easily import your Google portfolio into EquityStat.  Just follow these easy steps.

Step #1

Login to your Google Finance portfolio and click the Transactions link.

Step #2

On the Google Finance transactions page, click the Download to Spreadsheet link and save the downloaded file to your hard drive.

Step #3

Login to your EquityStat account and click the New menu at the top and choose Import Transactions from the drop down menu.

Step #4

On the import page, click the Browse button to locate the file saved in Step #2.  Next, click the Import button to import the file.  You will then see a summary of the transactions to be imported.  Correct any errors and verify what the import will do.  Click the Import Data button to import the Google Finance portfolio transactions into EquityStat.

New Feature – Cash Transactions

We have recently added a new feature.   You can now add cash transactions to your portfolio.  To add a cash transaction, click the New menu and then choose the “New Cash Transaction” menuitem from the drop down menu.  In the popup dialog, add the date of the cash transaction and the amount of the transaction.

Add Cash to Your EquityStat Portfolio
Add Cash To Your Investment Portfolio

Once you have added a cash transaction, any non-reinvested dividends added to your other investments will be added to your cash.

New Feature in the Portfolio Manager

EquityStat Portfolio Manager Stock Performance Graph

We have recently added a performance graph in the portfolio manager. For each investment in your portfolio you can see how that investment has performed over time. To see the investment graph, just click on an individual investment and the graph will display at the bottom right next to your list of transactions for the investment.

Best and Worst Stocks of 2015

According to the Wall Street Journal the best stock of 2015 was Netflix.  It was up 134%.  The worst stock of 2015 was Chesapeake Energy.  It was down 77%.

You can see the list of best stocks here:

http://blogs.wsj.com/briefly/2015/12/31/5-best-performers-in-the-sp-500-in-2015/

You can see the list of worst stocks here:

http://blogs.wsj.com/briefly/2015/12/31/5-worst-performers-in-the-sp-500-we-only-counted-energy-stocks-once/

How did your investments do in 2015?  What was your best stock?  What was your worst? If you are not tracking your investment’s performance, consider using EquityStat.  With EquityStat you can track the overall performance of your portfolio as well as the performance of each individual investment.  EquityStat tracks the annualized return, year to date return, daily gain, overall gain and many other metrics of your investments.  With these metrics you can easily determine what are your best investments and what are your worst investments.

New Features in the Portfolio Manager

We have added a few new features to the portfolio manager.

Portfolios

You can now create multiple portfolios to group your investments from multiple accounts.  For example, you can have a portfolio for your stocks, mutual funds and 401k.  To create a new portfolio click the New menu and then choose the New Portfolio menuitem.  Click here to learn more about portfolios.

New Performance Metrics/Columns

We have added a few new performance metrics – Quarter Return, P/E ratio and Dividend Yield.  To see these columns in your portfolio click the Options menu and then choose the Change Columns menuitem.

Maximize Portfolio

There are times when all the investments in the top portion of your portfolio don’t display.  To see all of your investments you have to scroll around.  We have added the ability to maximize the portfolio so that we display as many investments as we can.   To maximize your portfolio click the three line graphic in the upper left hand corner of your portfolio and choose Maximize from the drop down menu.  The top portion of your portfolio will be expanded and the transaction section will be moved down to accommodate the investments section.  This just gives you a way to make the most of your screen space and display more of your investment data.  To restore your portfolio in panes (the default setting) click the Restore menuitem from the drop down menu.

Do you have any ideas for a new feature? Contact us and let us know.


Creating multiple portfolios – New Feature

We recently added a new feature to your EquityStat portfolio manager. You can now create multiple portfolios for your account. Having multiple portfolios gives you the ability to group and separate your investments. For example, you can have a portfolio for your individual stocks, a portfolio for your mutual funds and a portfolio for your 401K.

To add a new portfolio click the New menu and then chose the New Portfolio menuitem from the dropdown menu.

Create a New EquityStat Portfolio
How to create a new portfolio in EquityStat

You will then see two new tabs. A tab for your current portfolio and a tab for your new portfolio.

Change Portfolio Name EquityStat
How to change the portfolio name

To edit the name of your portfolio click the pencil icon, which will display an edit box.

Edit Portfolio Name
How to edit a portfolio name.

Next type over the current portfolio name with the new portfolio name and click the Save button.

View portfolio investments
View a specific portfolio

To view the investments of each portfolio click on the portfolio’s tab. From here you can also add new investments to the portfolio as well as edit investments.

To view the view the performance all your entire account (all portfolios) click the Account Value box at the top.

To delete a portfolio first delete all the investments in the portfolio. Once the portfolio is empty, click the ‘X’ icon in the portfolio tab.

Changing Columns in Your Portfolio

By default we display a pre-configured set of columns for your portfolio.  If you desire you can easily change the columns that are displayed in your portfolio.  To do this click the Options link at the top of your portfolio and choose the Change Columns menuitem.

Change Performance Metrics in EquityStat's Investment Portfolio Manager
Change Columns In Your Portfolio

Clicking the Change Columns menuitem will display a list of columns that are available and a list of columns your are currently using.  You can add and remove columns as well as change the order of your columns.  If you want a description of a column, just click on the column in either of the lists.

When you are finished change your columns, click the Change button to save your changes and get back to your portfolio.

How did your investments do in 2014?

According to the Wall Street Journal the best stock of 2014 was Southwest Airlines (LUV).  It was up 123%.  The worst stock of 2014 was Transocean (RIG).  It was down 62%.

You can see the list of best stocks here:

http://blogs.wsj.com/briefly/2014/12/31/5-best-stocks-of-2014/

You can see the list of worst stocks here:

http://blogs.wsj.com/briefly/2014/12/31/5-worst-stocks-of-2014/

How did your investments do in 2014?  What was your best stock?  What was your worst?

If you are not tracking your investment’s performance, consider using EquityStat.  With EquityStat you can track the overall performance of your portfolio as well as the performance of each individual investment.  EquityStat tracks the annualized return, daily gain, overall gain and many other metrics of your investments.  With these metrics you can easily determine what are your best investments and what are your worst investments.