New Feature in EquityStat’s Stock Portfolio Tracker

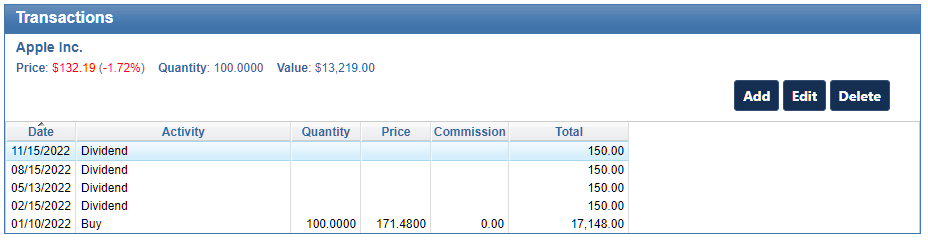
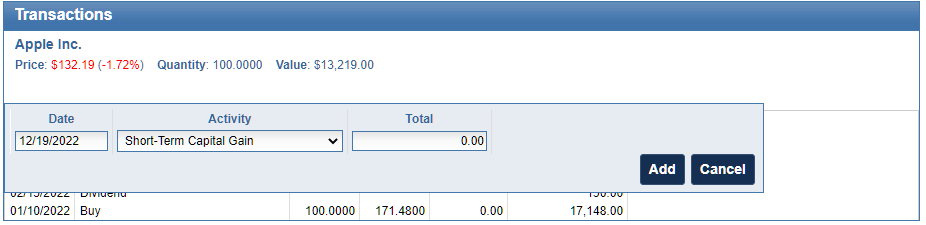
We have added a new feature to our Stock Portfolio Tracker application. When you enter a new stock/investment or add a new transaction for an existing stock/investment, the price of the investment is automatically displayed in the Price field. The price that is displayed is the closing or current price for the date of the transaction. If this price is not correct, you can override the price by entering the correct price.

This feature was designed in case you don’t know the exact price you purchased or sold a stock for, the price is automatically filled in for you and you don’t have to look it up. If you do know the exact price, you can override the filled in price with the correct price.

EquityStat Stock Portfolio Tracker New Feature - Auto Price
Example of Auto Price

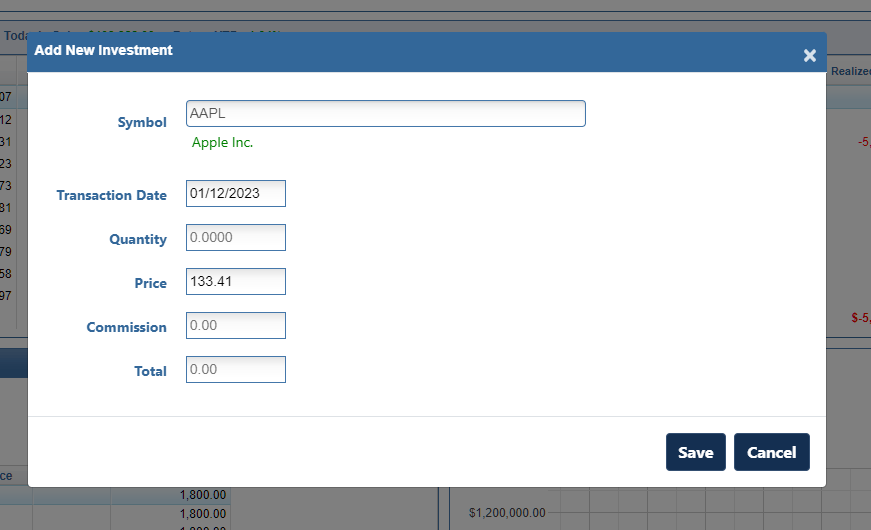
For example, if your purchased Apple stock on January 12, 2023 the price of $134.56 will automatically be filled in since this was the closing price on January 12th. If you purchased Apple for a lower or higher price, you can edit the price to the correct price.

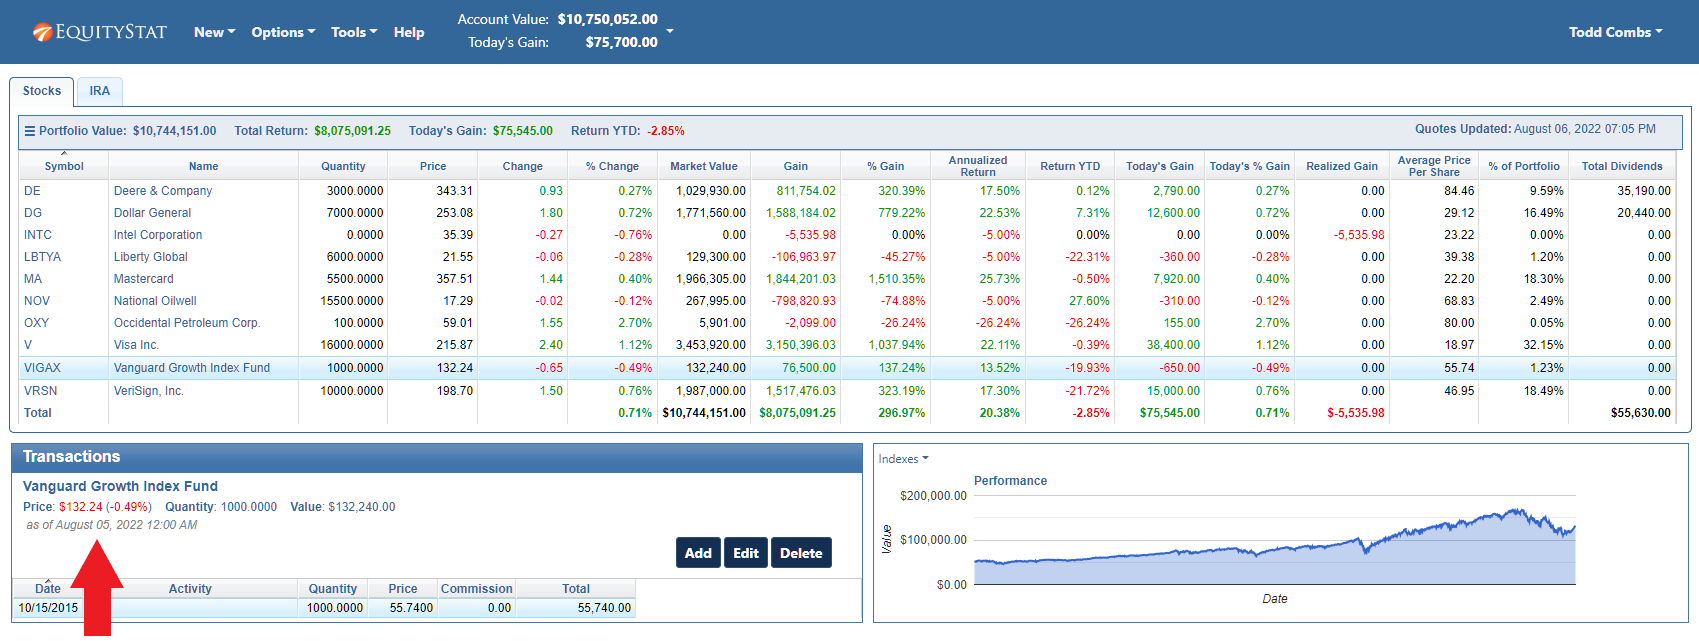
This feature also comes in handy when you want to see what price a stock was trading for a past date. Just select the stock, enter the date and you will see the price for that date.

‘Tis the Season For Dividends and Capital Gains

It is that time of year when stocks and mutual funds pay their end of year dividends, short-term capital gains and long-term capital gains.

With EquityStat’s stock portfolio manager, it is easy to track and manage these dividends and capital gains.

If you have a stock or mutual fund that has paid a distribution, select the stock in your portfolio. Then in the transactions panel, click the Add button to add a new transaction.

Add dividend, short-term capital gains and long-term capital gains to your EquityStat stock portfolio.
Transaction Panel Example

Next, select whether you were paid a dividend, short-term capital gain or long-term capital gain from the Activity drop down. If you re-invest your dividends and capital gains, then you can select re-invested dividends, re-invested short-term gains, or re-invested long-term gains from the Activity drop down.

Once you have selected your distribution type, enter the rest of your dividend information and click the Add button.

Add dividend, short-term capital gains and long-term capital gains to your EquityStat stock portfolio.
Example of entering a short-term capital gain.

There are a couple of ways to track your dividends. For each stock you can display the amount of dividends (including short-term and long-term capital gains) the stock has paid. To display this metric, click the Options menu at the top and choose the Change Columns option from the drop down menu. Then add the Total Dividends to the list of displayed columns.

The analyze portfolio page also displays the amount of dividends paid (this includes short-term and long-term capital gains) over a period of time for your entire account or for a specific portfolio. To view the analyze portfolio page, click the Tools menu at the top and choose Analyze Portfolio option from the drop down menu.

EquityStat User Interface Changes

In the transaction panel, we now display the date the mutual fund price was last updated. Mutual fund prices are updated after market close. When viewing the price, you don’t know if the price is from the previous day or it is the current price. So, for mutual funds we have added the date the price was updated. This way you can know if the price is the current price or the price from the previous day.

EquityStat Mutual Fund Price Date

We have also added the percent change for the price for all investments and display the price in green if the price is up and red if the price is down.

Also, you can click on the name of the investment to view additional information about the investment on MSN Money.

Refresh User Interface For Mobile Phones

We have recently refreshed the user interface of your EquityStat portfolio on mobile devices. The user interface now looks, feels and works like a mobile app. If you have ever used the Weather Channel App or the ESPN App on your mobile phone, EquityStat works very similar.

To view your EquityStat account on a mobile phone, open up the phone’s web browser, go to www.equitystat.com and login to your account.

EquityStat stock portfolio tracker on a mobile phone.
Example EquityStat Account on a Mobile Phone.

You will then see a list of all your portfolios at the top. You can swipe left at the top to scroll through all of your portfolios. Tap a “portfolio box” to see the investments in each portfolio.

To see details about a specific investment, tap the symbol for the investment. To view metrics about a specific investment tap the price button. Continue tapping the button to cycle through all of the investment metrics.

To add a new investment to your portfolio, tap the plus icon.

Splitting a Stock in EquityStat

Amazon’s (AMZN) stock recently split. It was a 20 for 1 stock split. So, for each share you owned before the split, you got 20 shares.

If you owned Amazon (AMZN) stock before the split and you are tracking this stock in your EquityStat portfolio, how do you record the split?

First, select the Amazon stock in your investment panel. Next, in the transaction panel, click the Add button to add a new transaction. In the Activity drop down, choose a “Split” transaction. Enter how many shares were split, in this case it is a 20 for 1 split, and click the Add button to save the transaction.

Add a split transaction in EquityStat's investment portfolio tracker.
Adding a split transaction in your EquityStat portfolio

When the split transaction is saved, each transaction will be adjusted to reflect this split. The number of shares will be increased twenty times and the price will be divided by twenty.

For example, if you had the following transactions before the split.

EquityStat transactions for Amazon (AMZN) before the 20 for 1 split
Amazon transactions before the split

After the split your transactions will look like this.

EquityStat transactions for Amazon (AMZN) after the 20 for 1 split
Amazon transactions after the split

Notice that before the split there were three buy transactions. After the split, the number of shares has increased 20 times and the price has been reduced by a factor of twenty. For example, the initial buy on 4/02/2014 was for a quantity of 100 shares. After the split, the purchased quantity is 2000 shares. The price the shares were bought on 4/02/2014 was $341.96. After the split, the price paid was $17.098. These adjustments are all automatically done when you enter the split transaction.

If you have other stocks that have split, you can use the same steps to record your split. Just make sure that you enter the correct split information.

Feature Highlight – Compare Your Investment Performance to the Dow Jones, the Nasdaq or the S&P 500 Index

If you want to see how your investment performance is doing compared to an index, you can easily add an index to your investment’s performance graph.

To do this, select the index you want to compare, by clicking on the Indexes drop down menu link in the upper left hand corner of the performance graph.

Compare Stock Performance to Indexes
Compare Investment Performance to Indexes

When you click on the Indexes drop down menu link, you can choose from a list of indexes.

Choose to compare your stock's performance to the Dow Jones index, the Nasdaq index or the S&P 500 index
Choose to compare your stock’s performance to the Dow Jones index, the Nasdaq index or the S&P 500 index

Choose the Dow Jones index, the Nasdaq index or the S&P 500 index. You can choose one index or multiple indexes. When you choose an index, you will see a checkbox next to the index.

Once an index is chosen, you will see the index in your performance graph and how it compares to your investment’s performance.

To remove an index, click on the Indexes drop down link and select the index again. This will remove the checkbox from the index menu item and remove the index from your performance graph.

You can also compare your account/portfolio performance to an index. To do this, go to the Portfolio Analysis page by choosing the Tools menu at the top and selecting Analyze Portfolio from the drop down menu. From the Portfolio Analysis page, click the Indexes link above the performance graph and choose the index or indexes you want to compare.

Choose to compare your account/portfolio performance to the Dow Jones index, the Nasdaq index or the S&P 500 index

How to import your Google Finance Portfolio into EquityStat

As you know, Google Finance is discontinuing their portfolio manager.  If you are looking for an alternative you can easily import your Google portfolio into EquityStat.  Just follow these easy steps.

Step #1

Login to your Google Finance portfolio and click the Transactions link.

Step #2

On the Google Finance transactions page, click the Download to Spreadsheet link and save the downloaded file to your hard drive.

Step #3

Login to your EquityStat account and click the New menu at the top and choose Import Transactions from the drop down menu.

Step #4

On the import page, click the Browse button to locate the file saved in Step #2.  Next, click the Import button to import the file.  You will then see a summary of the transactions to be imported.  Correct any errors and verify what the import will do.  Click the Import Data button to import the Google Finance portfolio transactions into EquityStat.

Print Your Stock Portfolio

We have recently added the ability to print your portfolio.  To print your portfolio click the Tools menu and then choose Print Portfolio from the drop down menu.  On the next page, choose which portfolio you want to print.  You can also print all your portfolio at once.  Clicking the Print button will generate a pdf file which you can then print to your printer or save to your hard drive.

EquityStat Print Stock Portfolio Example

View Your Portfolio On Your Mobile Device

We have recently added the ability to view your portfolio on your mobile device. To view your portfolio on your mobile phone, launch your phone’s web browser and go to www.equitystat.com. Next, login to your EquityStat account. You will then see a scaled version of your portfolio designed to display on your mobile device.

Watch the following video to learn more about the features of the mobile portfolio manager.

EquityStat and Taxes

It’s that dreaded time of year – tax time. EquityStat’s portfolio manager has several tools to help investors with their taxes.

If you sold any shares last year, you can use EquityStat to generate IRS Form 8949.  IRS Form 8949 is a form that shows your short-term  and long-term capital gains on any investment sale.  EquityStat will automatically calculate these capital gains.  It will then generate a PDF of Form 8949 with all needed information that the IRS requires.  You can then give this form to your tax preparer when you are preparing your taxes.  To generate IRS Form 8949, click the Tools menu and then choose the Generate Form 8949 menuitem.

Use EquityStat To Print IRS Form 8949
IRS Form 8949 Example

Another tool to help you with your taxes is the ability to export your investment’s transactions to a spreadsheet. To export your transactions, click the Tools menu and then choose the Export Transactions menuitem. When you export your transactions, you will get a spreadsheet showing each transaction for the investment including the type of transaction it is (e.g. Buy, Sell, Dividend, etc). With this information, your tax preparer can calculate your taxable capital-gains and taxable dividends for all of your investments.