Stock Portfolio Tracker Features
EquityStat's stock portfolio manager features.
Portfolio Features
- Manage all of your stocks, mutual funds and ETFs.
EquityStat brings your stocks, mutual funds, and ETFs together in one stock portfolio tracker, so you're not piecing your financial picture together from separate brokerage logins.
- Up to the minute stock, mutual fund and ETF quotes.
Prices update automatically throughout the trading day, so the value and performance numbers you're looking at always reflect current market data, not a stale snapshot from your last login.
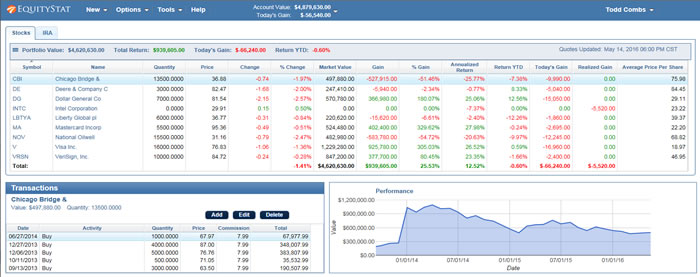
- Instantly see the value of your portfolio based on current investment prices.
Because investment prices update automatically, your total portfolio value stays current the moment you open EquityStat, without needing to manually refresh or recalculate anything yourself.
-
Create multiple portfolios to separate your investments (e.g. Stocks, Mutual Funds, 401k).
If you want to keep different accounts separate, you can organize your investments into as many portfolios as you like, then still see everything rolled up together when you want the full picture.
- Track the performance of your stocks, mutual funds and ETFs.
Every holding is tracked individually, so you can see exactly which investments are driving your returns and which ones are underperforming.
- Track your investment's gain, quarterly return, year-to-date return and annualized return.
Beyond simple gain or loss, EquityStat calculates the performance metrics serious investors actually use to evaluate an investment over time, so you can compare holdings on equal footing regardless of how long you've held them.
- Track your dividends for each investment, portfolio and for the entire account.
As a dedicated stock dividend tracker, EquityStat logs dividend income at the individual holding level and rolls it up to the portfolio and account level, giving you a clear picture of your total dividend income across everything you own.
- Easily view all transactions for an investment.
Every transaction for a given holding, including buys, sells, dividends, splits, and capital gains, is recorded in your transaction history, so you never have to dig through old brokerage statements to reconstruct what happened.
- Track and manage your buys, sells, dividends, splits and much more for each investment.
You can log every type of transaction, directly against the relevant holding, keeping a complete and accurate record for each investment in your stock portfolio manager.
- Easily lookup investments by symbol or name.
Adding a new holding takes seconds. Just search by ticker symbol or company name and EquityStat pulls in the investment details for you.
- Go back in time and display your portfolio on a past date.
You can view exactly what your portfolio looked like on any past date, which is useful for reviewing past performance, checking a specific point in time for tax purposes, or simply seeing how far you've come.
Portfolio Analysis
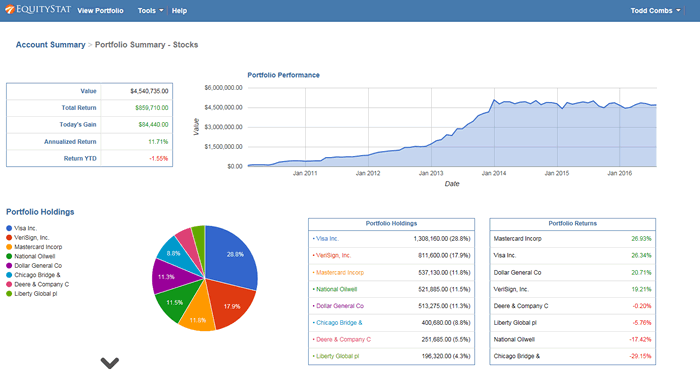
- Summary performance graphs and performance metrics for your account.
Your entire account's performance is visualized in summary graphs, so you can see your overall trajectory at a glance instead of piecing it together from individual holdings.
- Performance graphs for each individual investment.
Every stock, ETF, and mutual fund has its own performance graph, making it easy to spot which investments are outperforming or underperforming over time.
- Graphically compare your individual investments performance to the S&P 500, Dow Jones and Nasdaq indexes.
Raw returns only tell part of the story. EquityStat lets you benchmark each investment directly against the S&P 500, Dow Jones, and Nasdaq, so you can see whether a holding is beating, matching, or underperforming the index.
- Graphically compare your portfolio and account performance to the S&P 500, Dow Jones and Nasdaq indexes.
The same benchmarking applies at the portfolio and account level, giving you a clear answer to one of the most important questions in investing: is my overall strategy beating the index?
- Chart and analyze your account portfolio holdings.
A graph shows how your holdings are distributed across your account, giving you a clear sense of how much of each investment you own relative to everything else in your portfolio.
- Performance charts for your best and lowest investments for the day, year and quarter.
Quickly identify your top and lowest performers across different timeframes, so you know exactly where your gains and losses are coming from.
- Easily drill down into each portfolio for performance analysis.
Start at the account level and drill down into any individual portfolio for a closer look at performance, without losing the broader context of how it fits into your other investments.
- Chart and analyze your stock's dividends.
As part of EquityStat's stock portfolio analysis tools, dividend income is charted over time, so you can track growth in your dividend income the same way you'd track growth in share price.
Display
- View your portfolio on all your devices, computers, tablets and smartphones.
EquityStat is fully accessible whether you're checking your portfolio from a desktop at home or your phone on the go.
- View your portfolio on iPhones, iPads and Android phones.
No app download is required. EquityStat works directly in the browser on iPhone, iPad, and Android devices.
- Simple yet powerful interface.
The interface is designed to be easy to use for new investors while still providing the depth of data that more experienced investors expect from a serious stock portfolio manager.
- Responsive design that adapts to your tablet, smartphone or desktop screen size.
The layout automatically adjusts to whatever screen you're using, so you get a properly formatted view whether you're on a large monitor or a phone screen.
- Customize the data and performance metrics for your portfolio.
You can choose which performance metrics to display and which to hide, so your view only shows the numbers you actually care about.
- Customize the column order for your portfolio.
Rearrange the columns to match how you personally like to review your holdings.
- Sort your investments by name, value, return and gain.
Click on any column heading in your portfolio to sort your holdings by that column.
- Sort your transactions by date, transaction type and amount.
Your transaction history can be sorted the same way, making it easy to find a specific trade or review activity over a specific period.
Tax Reporting
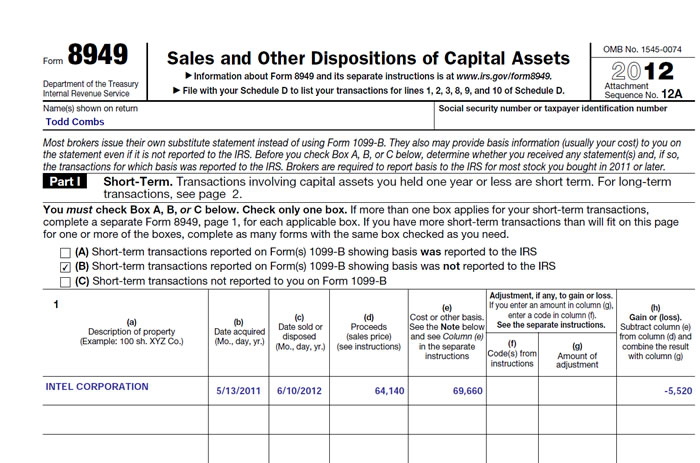
- Generate IRS Form 8949.
Form 8949 calculates your long-term and short-term gains and losses for any investments you sold during the year. EquityStat generates this form directly from your recorded transactions, so you can hand it straight to your accountant to calculate your taxes on those sales.
- Calculate your cost basis, gains and losses for the IRS.
Cost basis, gains, and losses are calculated automatically from your transaction history, giving you the exact figures the IRS requires without manual spreadsheet work.
Tools
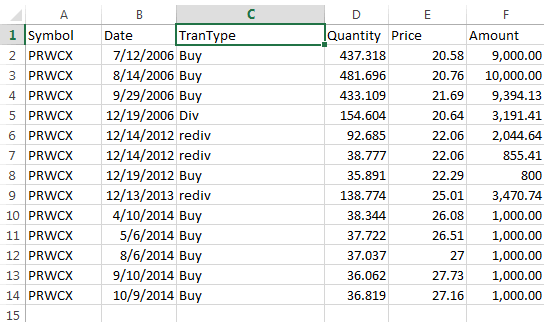
- Import your investment transactions from a spreadsheet.
You can import your transaction history from a spreadsheet, like Excel or Google Sheets, or CSV file exported from your brokerage, mutual fund, or 401(k), instead of re-entering everything by hand.
- Export your transactions to a spreadsheet for safe backup.
Your full transaction history can be exported to a spreadsheet, like Excel or Google Sheets, at any time, giving you an independent backup outside of EquityStat.
- Print your portfolio.
Generate a PDF of your portfolio that you can print or save for your records.
- Share an image of your portfolio on social media, forums, texts or email.
Generate a shareable image of your portfolio to post on social media or forums, or send by text or email, without giving anyone access to your account.
Help
- 24/7/365 real-human support.
If you run into a question, real people are available around the clock to help.
- Tutorials and tips on our blog