ETF Portfolio Tracker – How to Track Your ETFs With EquityStat

If you own exchange traded funds (ETFs), an ETF portfolio tracker can save you a lot of guesswork when it comes to understanding how your investment is actually performing. EquityStat makes this simple, because you add your ETFs to your portfolio the exact same way you would add individual stocks. There is no separate process to learn and no special account type to set up. You just enter the ETF symbol, the number of shares, and the purchase details, and EquityStat takes it from there.

ETFs Trade Like Stocks, Not Like Mutual Funds

One of the biggest differences between ETFs and mutual funds is how their prices behave. A mutual fund only updates their price once a day, after the market closes, based on its net asset value. An ETF is different. Even though it holds a collection of stocks, it trades on an exchange throughout the day, and its price moves in real time while the market is open. That means when you check EquityStat during market hours, the value of your ETF investment updates right along with the market, giving you a much more current picture of where your portfolio stands.

This is what makes ETFs appealing to a lot of investors. You get the diversification of owning a basket of stocks, but with the flexibility of trading in and out during the day like you would with any individual stock.

Tracking Dividends and Capital Gains From Your ETFs

Many ETFs pay out dividends, and some also distribute capital gains to shareholders. These payments matter, because they are part of your total return. EquityStat lets you record these transactions for your ETFs the same way you would for any stock, including regular dividends, short term capital gains, and long term capital gains.

If you reinvest these payments instead of taking them as cash, EquityStat handles that too. You can record reinvested dividends, reinvested short term capital gains, and reinvested long term capital gains, so your holdings and your cost basis stay accurate over time.

For those who would rather see the payments land as cash in their account, EquityStat can support that as well. Under Options and then Change Preferences, you can enable “Cash Transactions” along with “Dividend Transactions Deposit Into Cash”, and future dividend payments will flow into your cash balance automatically instead of being reinvested.

Seeing the Full Picture

Once your ETF dividend and capital gain history is in EquityStat, the Portfolio Analysis page pulls it all together. You can view a graph of dividends received over time, and check metrics like dividends year to date, dividends for the current quarter, expected dividends, and total dividends received. These numbers are available both at the individual portfolio level and across your entire account, so you can zoom in on one ETF or step back and see how your whole strategy is paying off.

Because EquityStat uses cost basis to calculate your investment return, you get a clearer view of your actual performance, not just a snapshot of price changes.

Getting Started

If you already use EquityStat to track your stocks, adding your ETFs takes just a few minutes. Enter your ETFs investments the same way you always have, and let the platform handle the rest, from almost real time pricing during market hours to dividend and capital gain tracking. It is one more way to keep your entire portfolio, stocks and ETFs alike, organized in a single place.

AOL My Portfolio Is Gone. Here Is Where to Track Your Stocks Now

If you are searching for AOL My Portfolio, you have probably already discovered that it does not exist anymore. For years it was one of the simplest ways to track your stocks. Then AOL shut down its finance tools, and a lot of people who relied on it for tracking their investments were left without a home for that data.

The good news is the features of AOL My Portfolio, like watching your stocks, checking gains and losses, keeping tabs on dividends, is still very doable. You just need a new place to do it.

What people actually miss about AOL My Portfolio

Most investors did not love AOL My Portfolio because it was flashy. They liked it because it was simple. You added your stocks, you monitored how they were performing, and that was mostly it. There was not a steep learning curve and not a lot of clutter getting in the way of the performance metrics you actually cared about.

A lot of portfolio tools try to do everything at once and end up feeling more like a trading terminal than something you would check with your morning coffee. Most people did not love AOL My Portfolio because it was flashy. They liked it because it was simple. You added your stocks, you saw how they were doing, and that was mostly it. There was not a steep learning curve and there was not a lot of clutter getting in the way of the numbers you actually cared about.

A lot of portfolio tools try to do everything at once and end up feeling more like a trading terminal than something you would check with your morning coffee. A replacement stock portfolio tracker should have this same simplicity.

What features should a replacement have?

Before picking a new tool, it helps to think about what you want out of it beyond just a list of investments.

A great investment portfolio tracker should be easy to use, and allow you to track stocks, ETFs, and mutual funds. It should offer a variety of performance metrics, not just a basic gain or loss number. It should let you compare your performance against market indexes, so you have some sense of how you are actually doing relative to the broader market. Viewing a graph of your investment performance makes it easy to see how your investments are doing at a glance.

If you want to go a step further than AOL’s My Portfolio features, look for a tool that lets you track dividends, reinvested dividends, and capital gains.

Getting your portfolio set up again

Starting over does not have to mean starting from scratch in terms of effort. Most of the work is just re-entering your investment purchases and other transactions.

Here is a simple way to approach it.

First, gather whatever records you still have, whether brokerage statements, tax documents, or even an old spreadsheet where you jotted down purchase prices. Second, set up your account in EquityStat. Third, enter your purchase transactions rather than just the current share count, since this is what lets EquityStat calculate your real cost basis and your real return instead of a estimate.

It is a bit of setup, but once it is done you end up with something far more accurate than what AOL My Portfolio ever gave you in the first place.

Moving forward

Losing a tool you were used to is frustrating, even one as simple as AOL My Portfolio. The upside is that rebuilding gives you a chance to track your investments with more accuracy than before, especially when it comes to dividends and true cost basis.

If you decide to move your portfolio into EquityStat, take the time to enter your investment purchases and dividend history correctly from the start. It makes every number that follows worth trusting.


How to Track Stock Gifted to Grandchildren

Learning how to track stock gifted to grandchildren is not something most families think about until years later, when a few old shares turn out to be worth far more than anyone expected. That is exactly what happened in a story a retired Merrill Lynch advisor shared in Barron’s, and it is worth reading for anyone who has ever bought stock as a gift and mostly forgotten about it since.

A stock nobody had heard of

In 1983, a grandmother walked into a Merrill Lynch office wanting to buy a Christmas gift for her three grandchildren. She wanted one share each of a company called Berkshire Hathaway. At the time it was not the household name it is today. The broker looked up the price, saw it trading around $2,000 a share, and thought it seemed expensive for a single share of stock most people had never heard of.

The grandmother saw it differently. She had grown up in Omaha and knew of the company’s chief executive Warren Buffett. She believed it was a good buy, bought the three shares, and the certificates went into the grandchildren’s stockings that Christmas.

What decades of compounding actually looks like

Berkshire Hathaway went on to perform far better than almost anyone could have predicted in 1983, and decades of compounding turned three modest shares into a position worth an estimated $2.3 million today. If the grandchildren did not sell the shares, they ended up wealthy, not because anyone made a brilliant trade, but because a good stock was bought and then simply left alone.

Why this kind of holding is so easy to lose track of

Stock given as a gift tends to disappear from view in a way that actively managed stock does not. There is rarely a clean record of the price the stock was purchased at, when dividends were reinvested, or how the original purchase turned into a gain or loss decades later. That gap between owning a stock and actually understanding it is where a good stock portfolio tracking tool like EquityStat matters most.

Seeing performance over the full holding period

EquityStat’s performance graphs let an investor see exactly how a stock has performed over time, not just what it is worth today. For a position held across decades, this view shows how the stock performed over the long-term.

That long view matters even more next to a benchmark. EquityStat lets investors compare their stock’s performance directly against market indexes like the Dow, the Nasdaq, and the S&P 500, so a big return can be measured against what the broader market did over the same period rather than judged in isolation.

How to track dividend reinvestment on a long held stock

A three share gift rarely stays three shares. Reinvested dividends quietly add to a position year after year, and most people holding a gifted stock have no real sense of how much of their eventual gain came from price appreciation versus decades of compounding dividends. Seeing that breakdown, both for the current quarter and going back over the full holding period, is the difference between a vague sense that a stock did well and a concrete understanding of why.

EquityStat’s Portfolio Analysis page was built for this kind of long horizon question. It shows dividends received over time, dividends year to date, dividends for the current quarter, and expected dividends ahead, at both the account level and portfolio level, so a gifted or long held position does not stay a mystery for forty years.

Tracking the dividends along the way

If Berkshire Hathaway had paid a dividend over those decades, EquityStat would have tracked it the same way it tracks dividends for any other stock, recording each payment and showing dividends received over time. That record matters for understanding income from a long held position, not just its price.

Why cost basis matters more than most investors realize

EquityStat also calculates cost basis automatically, and this is where reinvested dividends usually complicate things. Every time a dividend gets reinvested, it changes the cost basis of the position, and keeping that running total by hand over a multi decade holding period is not easy to do accurately. EquityStat handles the cost basis calculation as it happens.

Cost basis is not just a tax detail. It is required to figure out gain or loss when a stock is eventually sold, but it also plays a direct role in calculating the actual return on the investment. Without an accurate cost basis, there is no way to know how well a stock really performed, gift or otherwise.

The real takeaway

The grandmother in this story was not trying to predict the future. She trusted a company she understood and hopefully let the investment sit for decades. Most investors are not going to find the next Berkshire Hathaway, but any stock held long enough deserves the same basic discipline, and the same clear record of its cost basis, dividends, and performance against the market. That record is what eventually turns a forgotten gift into a number a family can actually use.

Why You Can’t See Your Real Investment Performance From Any Single Brokerage App

Open your brokerage app right now and it will tell you exactly how that account is doing. What it won’t tell you is how you’re doing. If you also have a 401(k) with a former employer, an IRA at a different provider, or a handful of mutual funds bought years ago, your brokerage app has no idea any of that exists. It’s not being unhelpful, it simply can’t see outside its own walls. That’s the core problem with trying to understand your investment performance one account at a time, and it’s the reason a dedicated stock portfolio tracker exists in the first place.

Every Brokerage App Has the Same Blind Spot

Brokerage apps are built to serve one purpose, help you manage the money that is inside that specific brokerage. Fidelity’s app knows about your Fidelity account. Schwab’s app knows about your Schwab account. Neither one has any visibility into the other, and neither has any reason to build that visibility, since it isn’t their job to help you understand your finances outside their platform.

That means every number you see in a brokerage app, your return, your gain, your dividend income, is only ever a partial answer. If you’re checking three or four different apps to get a sense of where you stand, you’re not actually looking at your investment performance. You’re looking at fragments of it, and doing the aggregation yourself, in your head, imperfectly.

What You Actually Can’t See Without Aggregating

A few specific numbers are simply impossible to calculate from any single account:

  • Total return across everything you own. A single brokerage can tell you its own return, but not your blended return once a 401(k), an IRA, and a taxable brokerage account are all factored in together.
  • Combined dividend income. If you own dividend-paying stocks in more than one account, no single provider can show you your total dividend income for the year. Only a dedicated stock dividend tracker that pulls every account together can do that.
  • True asset allocation. Your brokerage app might show you’re well-diversified within that account, while you’re unknowingly overexposed to a single sector once your 401(k) holdings are counted too.
  • Overall net worth. Net worth isn’t a brokerage feature, it’s an aggregation problem. It only exists once every account, brokerage, retirement, and otherwise, is added together.
  • Which of your accounts is actually performing best. Without a side-by-side comparison, there’s no way to know whether your IRA, your brokerage account, or your old 401(k) is doing the heavy lifting, or dragging down your results.

None of these are edge cases. They’re the basic questions any investor eventually wants answered, and none of them can be answered by a tool that only sees one piece of the puzzle.

Why a Spreadsheet Doesn’t Really Solve It Either

The obvious workaround is to build a spreadsheet in Excel or Google Sheets and update it yourself. In practice, this breaks down quickly. Prices need to be looked up and re-entered by hand. Returns have to be recalculated with every trade. Dividends have to be logged manually as they arrive. It is not that a spreadsheet in Excel or Google Sheets cannot hold the data, it is that keeping it accurate becomes a part-time job.

A proper stock portfolio tracker application solves the maintenance problem specifically. It pulls current prices automatically and recalculates your returns as soon as you log a transaction, so the aggregated view stays accurate without you having to rebuild it every time something changes, the way you would need to in an Excel or Google Sheets file. You still enter your own trades and holdings, the same way you would in a spreadsheet, but the tracker takes over everything else, the pricing, the math, and the performance calculations.

What a Real Stock Portfolio Manager Should Show You

A tool built specifically to solve this problem, rather than a brokerage app that happens to show you a balance, should be able to answer the questions your individual accounts can’t:

  • Consolidated performance metrics. Gain, quarterly return, year-to-date return, and annualized return, calculated across your full portfolio, not just one account at a time.
  • Benchmark comparisons. The ability to see whether your overall strategy is beating, matching, or underperforming the S&P 500, Dow Jones, or Nasdaq, something no single brokerage account can tell you in isolation.
  • Dividend tracking at every level. Dividend income visible per investment, per portfolio, and across your entire account, so you always know your true income from holdings, not just the ones in one place.
  • Historical view. The ability to see what your full portfolio looked like on a past date, useful for reviewing performance over time or preparing for tax season.
  • Tax reporting that spans everything you sold. When it’s time to file, a consolidated tracker can generate IRS Form 8949 covering every sale across every account, calculating your long-term and short-term gains and losses so you can hand the report straight to your accountant.

This is the same reasoning EquityStat was built around from the start, investors who were managing their own money got tired of tools that could only see one slice of it, and built something that could see all of it instead.

The Real Cost of Not Aggregating

The risk of checking accounts separately isn’t just inconvenience, it’s blind spots that compound over time. An investor might feel diversified because each individual account looks reasonable, while their combined holdings are quietly concentrated in one sector or a handful of overlapping funds. Or they might underestimate how much they’re actually earning in dividends because it’s split across three accounts and never added up. Or they simply won’t know, in any given year, whether their overall strategy is working, because “overall” was never actually calculated.

None of these are dramatic failures. They’re just the slow cost of never having the full picture, and they’re avoidable the moment every account gets pulled into one place.

Frequently Asked Questions

Why can’t my brokerage app show me my total portfolio performance? Because it only has visibility into the account it manages. It has no data about your other brokerage accounts, your 401(k), or your IRA, so it can only ever report on its own slice of your investments.

Is a spreadsheet in Excel or Google Sheets a good enough substitute for a portfolio tracker? A spreadsheet in Excel or Google Sheets can hold the data, but keeping prices, returns, and dividends current requires ongoing manual work. A dedicated stock portfolio tracker automates the pricing and performance calculations, so the aggregated view stays accurate without constant upkeep.

What accounts should I include when tracking my investment performance? Every account that holds investments, brokerage accounts, 401(k)s, IRAs, and mutual funds, should be included. Leaving any of them out means your total return, dividend income, and asset allocation numbers will all be incomplete.

Can I see my net worth using a stock portfolio tracker? Yes, as long as the tracker supports multiple account types. Net worth is fundamentally an aggregation calculation, so it depends on having every account represented in one place rather than checked separately.
How to Track Dividends and Capital Gains in Your Stock Portfolio

Dividends and capital gains distributions land in your brokerage accounts all year long, but they tend to pile up at the end of the year, when mutual funds and ETFs make their final payouts. If you are not keeping track of them as they come in, it is easy to lose sight of how much income your portfolio is actually producing. It is even easier to end up hunting for numbers when tax season arrives.

EquityStat’s stock portfolio tracker makes it simple to record and monitor dividends, short term capital gains, and long term capital gains across every brokerage account you own, all from one screen

Why Tracking Dividends and Capital Gains Matters

Your brokerage’s website will show you dividends and gains for that one account. Most investors, though, hold assets in more than one place. Maybe you have a 401k through work, a taxable brokerage account you manage yourself, and an IRA somewhere else entirely. Look at any single one of those accounts and you are only ever seeing part of the story.

Keeping this information in one place helps in a few ways. You get an honest picture of how much dividend and capital gains income your whole portfolio produced this year, not just what one brokerage happens to report. You also make tax season easier on yourself, since short term and long term gains are taxed differently and it helps to know which is which well before your 1099s show up. And you get a truer read on how your investments are actually performing, since total return includes dividends and distributions, not just the change in share price.

Dividends vs Short Term vs Long Term Capital Gains

It helps to know which category a distribution falls into before you record it.

Dividends are cash payments a company or fund makes to its shareholders, usually out of earnings.

Short term capital gains come from an investment held for one year or less before it is sold. For mutual funds, this can also include short term gains the fund realized internally and passed along to you as a shareholder.

Long term capital gains come from an investment held for more than a year, and they are generally taxed at a lower rate than short term gains.

Mutual funds and ETFs often distribute some combination of all three at year end, which is exactly why it helps to use a tracker that keeps them separated clearly instead of lumping everything together.

How to Record Dividends and Capital Gains in EquityStat

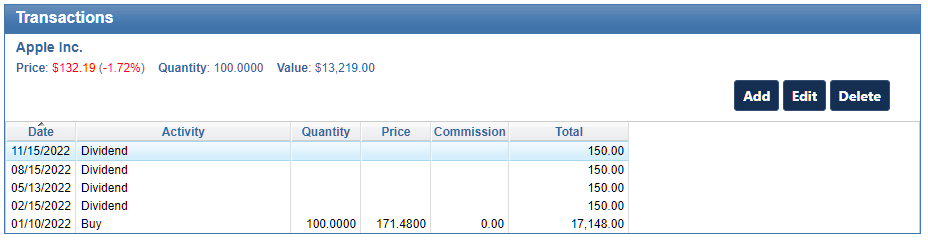
EquityStat transaction panel showing how to add a dividend or capital gain to a stock portfolio
Transaction Panel Example

Recording a distribution only takes a minute.

  1. Select the investment from your portfolio list.
  2. In the Transaction panel, click Add.
  3. Use the Activity dropdown to choose the type of distribution. For cash payments, select Dividend, Short Term Capital Gain, or Long Term Capital Gain. If the payout was used to buy more shares instead of being paid out as cash, select the Re Invested version of that same option.
  4. Enter the details of the distribution and click Add.

Once that is done, the transaction is reflected in your portfolio’s performance, cost basis, and income totals right away.

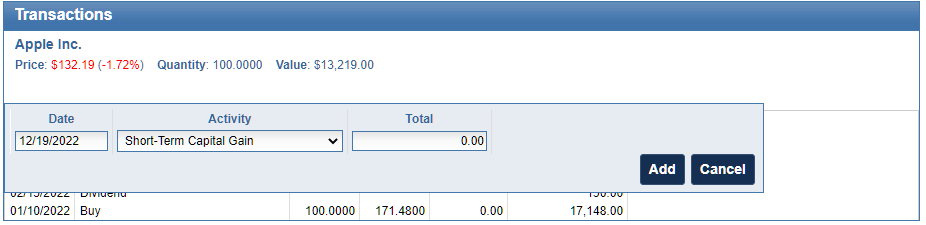
Example of entering a capital gain transaction in EquityStat
Example of entering a short-term capital gain.

How to View Your Total Dividend and Capital Gains Income

After you have recorded a few distributions, EquityStat gives you more than one way to see the full picture.

You can customize your portfolio columns by going to the Options menu and selecting Change Columns to add a Total Dividends column, which includes capital gains, directly to your main portfolio view. That way you can see income for each investment without digging through individual transactions.

You can also use the Analyze Portfolio page, found under the Tools menu, which provides graphical performance metrics for your entire account or for individual portfolios. It is a quick way to see income and returns over time without doing the math yourself.

Why This Matters Come Tax Time

When you track dividends and capital gains as they happen throughout the year, you are not stuck rebuilding twelve months of transactions in April. When it is time to file, EquityStat can also help you generate a capital gains report for IRS Form 8949, using the same transaction data you have already entered.

Frequently Asked Questions

Do I need to enter dividends manually in EquityStat? Yes. Dividends and capital gains distributions are entered through the Transaction panel for each investment, using the Activity dropdown to select the correct type of distribution.

What is the difference between short term and long term capital gains? Short term capital gains come from investments held for one year or less. Long term capital gains come from investments held for more than a year and are typically taxed at a lower rate.

Can I see total dividend income across my whole portfolio? Yes. Add the Total Dividends column to your portfolio view, or use the Analyze Portfolio tool for a graphical, account wide breakdown.

Does EquityStat help with tax reporting? Yes. EquityStat can generate a capital gains report formatted for IRS Form 8949 based on the transactions you have recorded.