Getting Started with EquityStat: A Quick Setup Guide For Your Stock Portfolio Tracker

Setting up EquityStat takes just a few minutes, and once your first investment is entered, you’ll have a working stock portfolio tracker you can build on. This quick getting started guide walks through adding your first investment, understanding your portfolio view, entering additional transactions, and keeping your portfolio organized as your holdings change over time.

Add Your First Investment

After you join EquityStat, you’ll be logged into your account. Since you won’t have any investments yet, you’ll see an empty portfolio screen. From here, click the New Investment button to add your first holding.
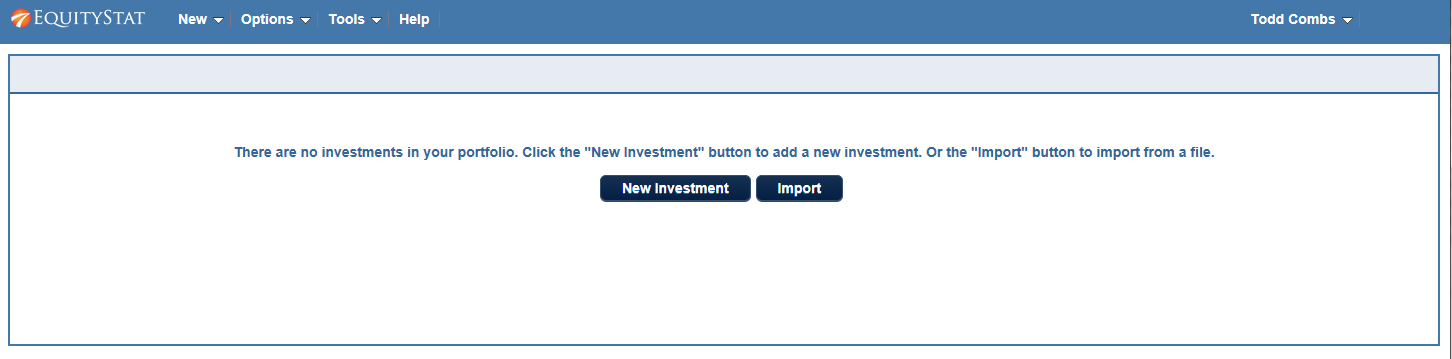
EquityStat Stock Portfolio Directions

Add transactions to EquityStatClicking New Investment opens a dialog where you can enter a buy transaction. Enter the symbol of the investment, the date of purchase, the number of shares purchased, and the price per share, then click Save. Once your first purchase is entered, you can go on to add other transactions for that same investment, including additional buys, sells, and dividends.

Understanding Your Portfolio View

Once you’ve added a few investments, your portfolio view will look something like the example below.
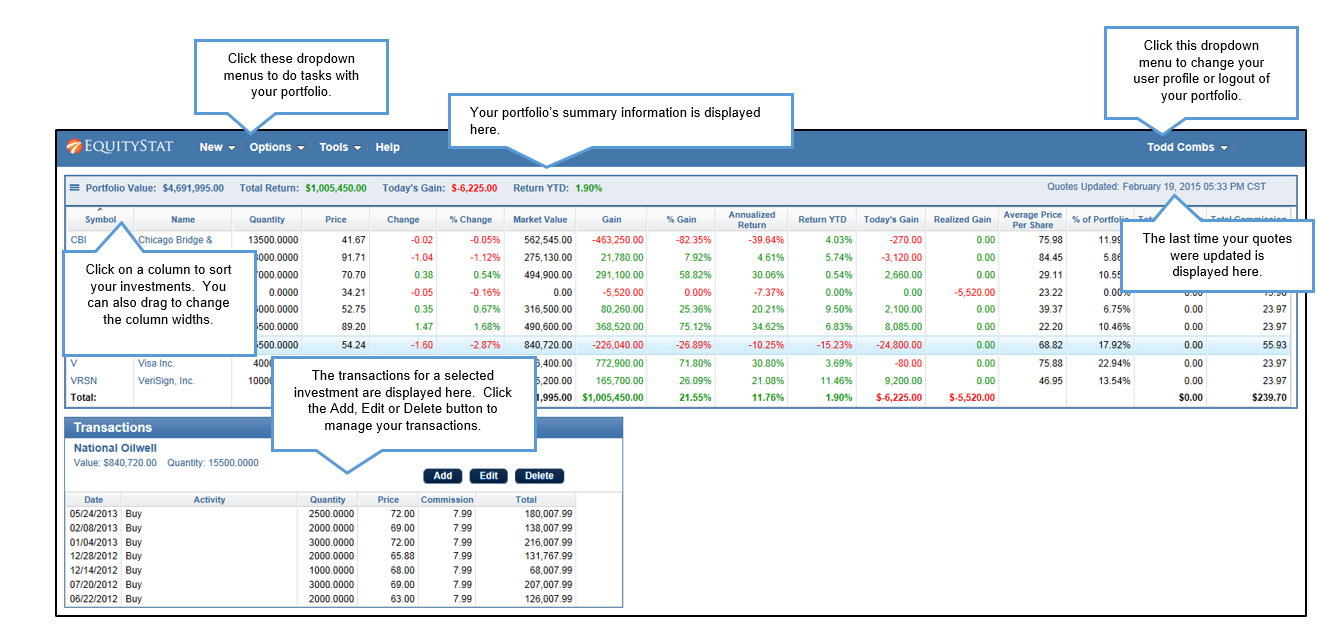
Getting Start With EquityStat Portfolio Tracker
Directions on EquityStat’s Portfolio Manager

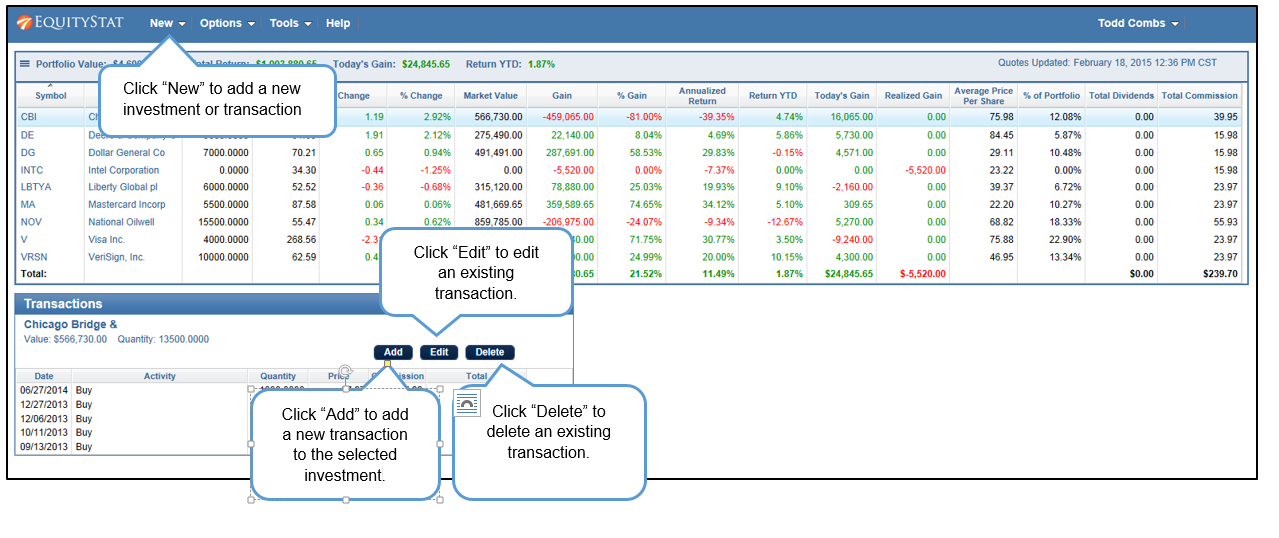
The top table lists all of your investments along with key performance metrics and data about each investment. Below it, you’ll see the transactions for whichever investment is currently selected. You can sort your investments and transactions by clicking any column heading, and you can widen a column by dragging its border. Above the investment table, a summary section shows your total portfolio value, total dollar return, day’s gain or loss, and year-to-date return, giving you an at-a-glance read on how your stock portfolio manager sees your overall performance.
Add Transactions to EquityStat's Investment Portfolio
How to add transactions to EquityStat

Adding More Investments

As your portfolio grows, you’ll need to log new investments and additional transactions.

To add an investment that isn’t in your portfolio yet, click the New menu and choose New Investment. To add a transaction to an investment you already hold, go to the transaction table below the investment table and click Add. A new row appears where you can record a buy, sell, dividend, or one of several other transaction types. You can edit an existing transaction by selecting it and clicking Edit, or remove one entirely with the Delete button. If you’re moving a large number of trades in at once, it’s often faster toImport your transactions from a csv file into EquityStat instead of entering them one at a time.

Hiding Sold Investments

Once you’ve sold out of a position entirely, you may not want it cluttering your active portfolio view.

Click the three-line icon on the left and choose Hide Sold Investments to remove fully sold holdings from view. To bring them back at any point, for example when you’re reviewing past performance, click the icon again and choose View Sold Investments.

Frequently Asked Questions

How long does it take to set up EquityStat? Adding your first investment takes less than a minute. A full portfolio with multiple holdings can typically be built out in under 15 minutes.

Can I import my existing transaction history instead of entering it manually? Yes. If you’re already tracking your investments elsewhere, you can import your transaction history from a Import your transactions into EquityStat rather than re-entering everything by hand.

What if I sell all of an investment, can I still see its history? Yes. Sold investments can be hidden from your active view to reduce clutter, but you can bring them back into view at any time to review their full history.
How to Track Dividends and Capital Gains in Your Stock Portfolio

Dividends and capital gains distributions land in your brokerage accounts all year long, but they tend to pile up at the end of the year, when mutual funds and ETFs make their final payouts. If you are not keeping track of them as they come in, it is easy to lose sight of how much income your portfolio is actually producing. It is even easier to end up hunting for numbers when tax season arrives.

EquityStat’s stock portfolio tracker makes it simple to record and monitor dividends, short term capital gains, and long term capital gains across every brokerage account you own, all from one screen

Why Tracking Dividends and Capital Gains Matters

Your brokerage’s website will show you dividends and gains for that one account. Most investors, though, hold assets in more than one place. Maybe you have a 401k through work, a taxable brokerage account you manage yourself, and an IRA somewhere else entirely. Look at any single one of those accounts and you are only ever seeing part of the story.

Keeping this information in one place helps in a few ways. You get an honest picture of how much dividend and capital gains income your whole portfolio produced this year, not just what one brokerage happens to report. You also make tax season easier on yourself, since short term and long term gains are taxed differently and it helps to know which is which well before your 1099s show up. And you get a truer read on how your investments are actually performing, since total return includes dividends and distributions, not just the change in share price.

Dividends vs Short Term vs Long Term Capital Gains

It helps to know which category a distribution falls into before you record it.

Dividends are cash payments a company or fund makes to its shareholders, usually out of earnings.

Short term capital gains come from an investment held for one year or less before it is sold. For mutual funds, this can also include short term gains the fund realized internally and passed along to you as a shareholder.

Long term capital gains come from an investment held for more than a year, and they are generally taxed at a lower rate than short term gains.

Mutual funds and ETFs often distribute some combination of all three at year end, which is exactly why it helps to use a tracker that keeps them separated clearly instead of lumping everything together.

How to Record Dividends and Capital Gains in EquityStat

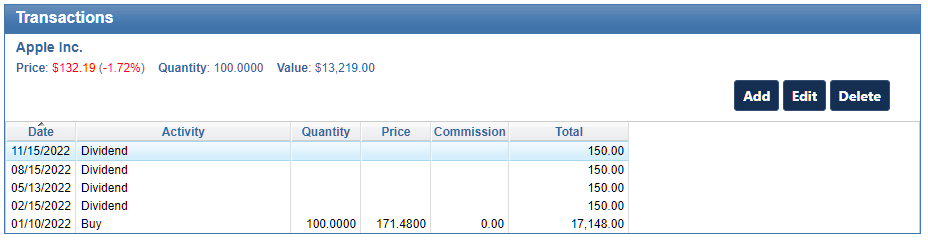
EquityStat transaction panel showing how to add a dividend or capital gain to a stock portfolio
Transaction Panel Example

Recording a distribution only takes a minute.

  1. Select the investment from your portfolio list.
  2. In the Transaction panel, click Add.
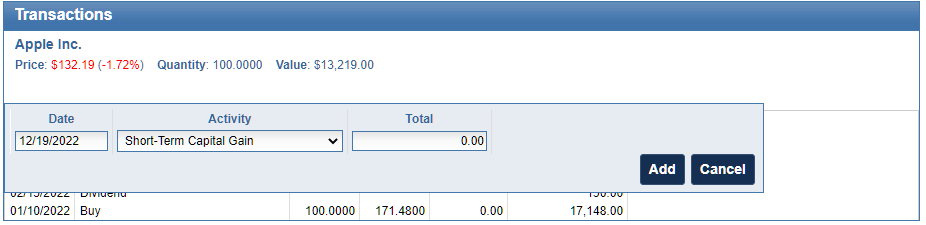
  3. Use the Activity dropdown to choose the type of distribution. For cash payments, select Dividend, Short Term Capital Gain, or Long Term Capital Gain. If the payout was used to buy more shares instead of being paid out as cash, select the Re Invested version of that same option.
  4. Enter the details of the distribution and click Add.

Once that is done, the transaction is reflected in your portfolio’s performance, cost basis, and income totals right away.

Example of entering a capital gain transaction in EquityStat
Example of entering a short-term capital gain.

How to View Your Total Dividend and Capital Gains Income

After you have recorded a few distributions, EquityStat gives you more than one way to see the full picture.

You can customize your portfolio columns by going to the Options menu and selecting Change Columns to add a Total Dividends column, which includes capital gains, directly to your main portfolio view. That way you can see income for each investment without digging through individual transactions.

You can also use the Analyze Portfolio page, found under the Tools menu, which provides graphical performance metrics for your entire account or for individual portfolios. It is a quick way to see income and returns over time without doing the math yourself.

Why This Matters Come Tax Time

When you track dividends and capital gains as they happen throughout the year, you are not stuck rebuilding twelve months of transactions in April. When it is time to file, EquityStat can also help you generate a capital gains report for IRS Form 8949, using the same transaction data you have already entered.

Frequently Asked Questions

Do I need to enter dividends manually in EquityStat? Yes. Dividends and capital gains distributions are entered through the Transaction panel for each investment, using the Activity dropdown to select the correct type of distribution.

What is the difference between short term and long term capital gains? Short term capital gains come from investments held for one year or less. Long term capital gains come from investments held for more than a year and are typically taxed at a lower rate.

Can I see total dividend income across my whole portfolio? Yes. Add the Total Dividends column to your portfolio view, or use the Analyze Portfolio tool for a graphical, account wide breakdown.

Does EquityStat help with tax reporting? Yes. EquityStat can generate a capital gains report formatted for IRS Form 8949 based on the transactions you have recorded.

Portfolio Analysis – New Feature

How to Analyze Your Investment Portfolio in EquityStat

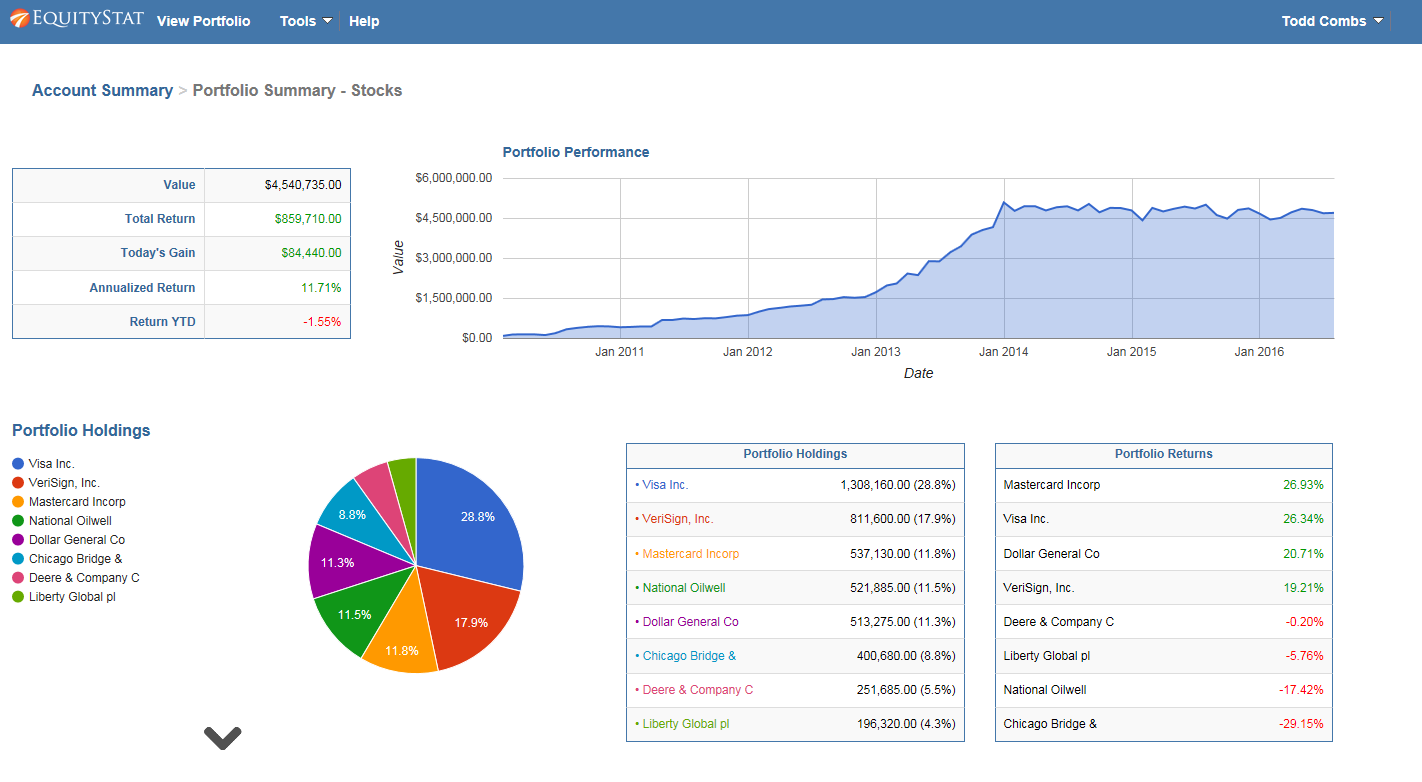
EquityStat has introduced a powerful Portfolio Analysis tool that helps investors evaluate performance, track holdings, and compare returns across multiple portfolios. This feature gives you a clear, data‑driven view of how your investments are performing over time.

What the Portfolio Analysis Tool Does

The Portfolio Analysis page provides a complete performance overview of your account and individual portfolios. You can quickly see:

  • Overall account performance over time
  • Portfolio‑level performance metrics
  • Investment holdings and allocation
  • Daily, quarterly, and yearly performance rankings
  • Best‑ and worst‑performing investments

This makes it easy to understand which assets are driving your returns and where adjustments may be needed.

How to Access Portfolio Analysis in EquityStat

To run a portfolio analysis:

  1. Click the Tools menu at the top navigation bar.
  2. Select Analyze Portfolio from the dropdown.
  3. The system will generate a detailed analysis of your account and portfolios.

What You’ll See on the Portfolio Analysis Page

Analyze your investment portfolio using EquityStat.
Analyze Portfolio Example

1. Account‑Level Performance Overview

If you manage multiple portfolios, the analysis begins with a full account‑wide performance summary, including:

  • A performance graph showing account growth over time
  • A breakdown of each portfolio’s performance
  • A ranked list of investment returns
  • A summary of all holdings across your account

2. Portfolio‑Specific Analysis

Click any portfolio name in the summary table to view:

  • Portfolio‑specific performance charts
  • Individual investment metrics
  • Best and lowest performers for the day, quarter, and year
  • A complete holdings list for that portfolio

If you only have one portfolio, the system automatically displays its analysis.

Key Performance Metrics Provided

The analysis includes detailed metrics such as:

  • Total return
  • Daily return
  • Quarterly return
  • Year‑to‑date return
  • Investment rankings
  • Growth charts

These insights help you understand how each investment contributes to your overall performance.

Why This Matters for Investors

Whether you’re a beginner or an experienced investor, having a clear view of your portfolio’s performance is essential. EquityStat’s Portfolio Analysis tool helps you:

  • Track long‑term investment growth
  • Identify top‑performing investment
  • Spot underperforming investments
  • Make informed decisions based on real data
  • Manage multiple portfolios with ease
  • Track dividend income across all portfolios

Best and Worst Stocks of 2015

According to the Wall Street Journal the best stock of 2015 was Netflix.  It was up 134%.  The worst stock of 2015 was Chesapeake Energy.  It was down 77%.

You can see the list of best stocks here:

http://blogs.wsj.com/briefly/2015/12/31/5-best-performers-in-the-sp-500-in-2015/

You can see the list of worst stocks here:

http://blogs.wsj.com/briefly/2015/12/31/5-worst-performers-in-the-sp-500-we-only-counted-energy-stocks-once/

How did your investments do in 2015?  What was your best stock?  What was your worst? If you are not tracking your investment’s performance, consider using EquityStat.  With EquityStat you can track the overall performance of your portfolio as well as the performance of each individual investment.  EquityStat tracks the annualized return, year to date return, daily gain, overall gain and many other metrics of your investments.  With these metrics you can easily determine what are your best investments and what are your worst investments.

New in EquityStat: Multiple Portfolios, Expanded Performance Metrics, and a Maximize View

Managing investments effectively requires tools that are flexible, intuitive, and powerful enough to handle real-world portfolios. These enhancements to EquityStat’s Portfolio Manager adds three specific improvements: the ability to create multiple portfolios, three new performance metrics (quarterly return, P/E ratio, and dividend yield), and a Maximize Portfolio view that expands your investment list to fill more of the screen. Together, these changes make it easier to organize multiple accounts, analyze performance more deeply, and view your investment data in a cleaner, more streamlined layout.

Whether you’re tracking stocks, mutual funds, ETFs, or retirement accounts, these new features help you stay on top of your financial picture with greater accuracy and efficiency.

Create and Manage Multiple Portfolios with Ease

One of the most significant upgrades is the ability to create multiple portfolios within your EquityStat account. This feature is ideal for investors who want to separate or categorize their holdings across different accounts or investment strategies.

Why Multiple Portfolios Matter
  • Better organization – Keep your brokerage accounts, retirement accounts, and long‑term holdings separate.
  • Clearer insights – Compare performance between strategies (e.g., growth vs. income).
  • Simplified reporting – Generate cleaner summaries for taxes, advisors, or personal tracking.

How to Create a New Portfolio

You can create a new portfolio directly from the New menu by selecting New Portfolio. Once created, each portfolio can be customized with its own set of investments, performance metrics, and display preferences.

New Performance Metrics for Deeper Investment Analysis

To help investors make more informed decisions, EquityStat has added several new performance‑focused data columns:

Newly Added Metrics

  • Quarterly Return – Track short‑term performance trends and identify momentum.
  • P/E Ratio (Price‑to‑Earnings) – Evaluate whether a stock is undervalued or overvalued.
  • Dividend Yield – Quickly see which holdings generate income and how much.

These metrics can be enabled from the Options menu under Change Columns, allowing you to tailor your dashboard to the data that matters most to you.

Maximize Your Portfolio View for Better Visibility

Large portfolios can sometimes require scrolling or navigating between panes to see all your holdings. To solve this, EquityStat now includes a Maximize Portfolio feature that expands your investment list to fill more of your screen.

What Maximize Mode Does

  • Expands the investment section to show more rows at once
  • Moves the transaction section downward for a cleaner layout
  • Reduces the need for scrolling and window adjustments

This is especially useful for investors with extensive holdings or those working on smaller screens.

To activate it, click the three‑line menu icon in the upper‑left corner of your portfolio and select Maximize. You can return to the default pane layout anytime by choosing Restore.

Why These Updates Matter for Investors

These enhancements aren’t just cosmetic, they are designed to improve the way you interact with your financial data:

  • Faster decision‑making thanks to clearer metrics
  • More efficient navigation with customizable portfolios
  • Better organization for multi‑account investors
  • Improved user experience across devices

As the investing landscape becomes more complex, having a flexible and powerful portfolio tracker is essential. EquityStat continues to evolve its tools to support both new and experienced investors.

Have Ideas for Future Features?

EquityStat actively welcomes feedback from its users. If you have suggestions for new tools, metrics, or improvements, the team encourages you to reach out and share your ideas. User input plays a key role in shaping future updates.

Contact us and let us know.


Behind the Design of EquityStat’s Portfolio Manager

EquityStat’s stock portfolio tracker was built for investors by investors. As investors, we found that many portfolio managers just didn’t work the way we wanted them to. Whether the portfolio manager came from a brokerage account, a mutual fund provider, or a software company, many of them just didn’t work well. That frustration was a driving force behind building EquityStat’s portfolio manager the way we did.

Automatic Price Updates

The Problem With Manual Refreshing

One major problem with other portfolio managers is that they don’t refresh your investment prices and portfolio value automatically. To see your latest values, you have to manually refresh the page yourself, every single time you want a current number.

How EquityStat Handles It

We did not want our portfolio manager to behave this way. With EquityStat, your prices and portfolio values update automatically without you having to refresh the page. Every 15 minutes, we query the latest prices for your investments and update your portfolio accordingly. In the upper right-hand corner, we even display the last time your quotes were updated, so you always know exactly how current your data is. All of this happens automatically in the background, without you having to constantly refresh the page just to see how your investments are performing.

Background Transaction Saving

The Problem With Entering Transactions

Another common problem with other portfolio managers is entering transactions. When you enter a transaction, many portfolio managers will post it back to the web server and then do a full page refresh to show the new data. It works, but it is cumbersome, especially if you’re entering several transactions in a row.

How EquityStat Handles It

EquityStat’s portfolio manager handles this differently by doing all of the saving in the background. When you add or edit a transaction, it is saved and updated behind the scenes automatically. The only thing you’ll see is a brief notification at the top of your portfolio letting you know the transaction has been saved. The benefit is less page refreshing and a more natural, less cumbersome way of entering your investment activity, whether you are logging a single trade or updating your portfolio after a busy trading day.

Why It Matters

Small design decisions like these add up. A stock portfolio tracker that constantly needs to be refreshed, or that interrupts you every time you log a transaction, gets in the way of the thing it is supposed to help with, actually understanding how your investments are doing. Automatic price updates and background transaction saving were two of the earliest design choices we made with that in mind, and they are still core to how EquityStat works today.

Changing Columns in Your Portfolio

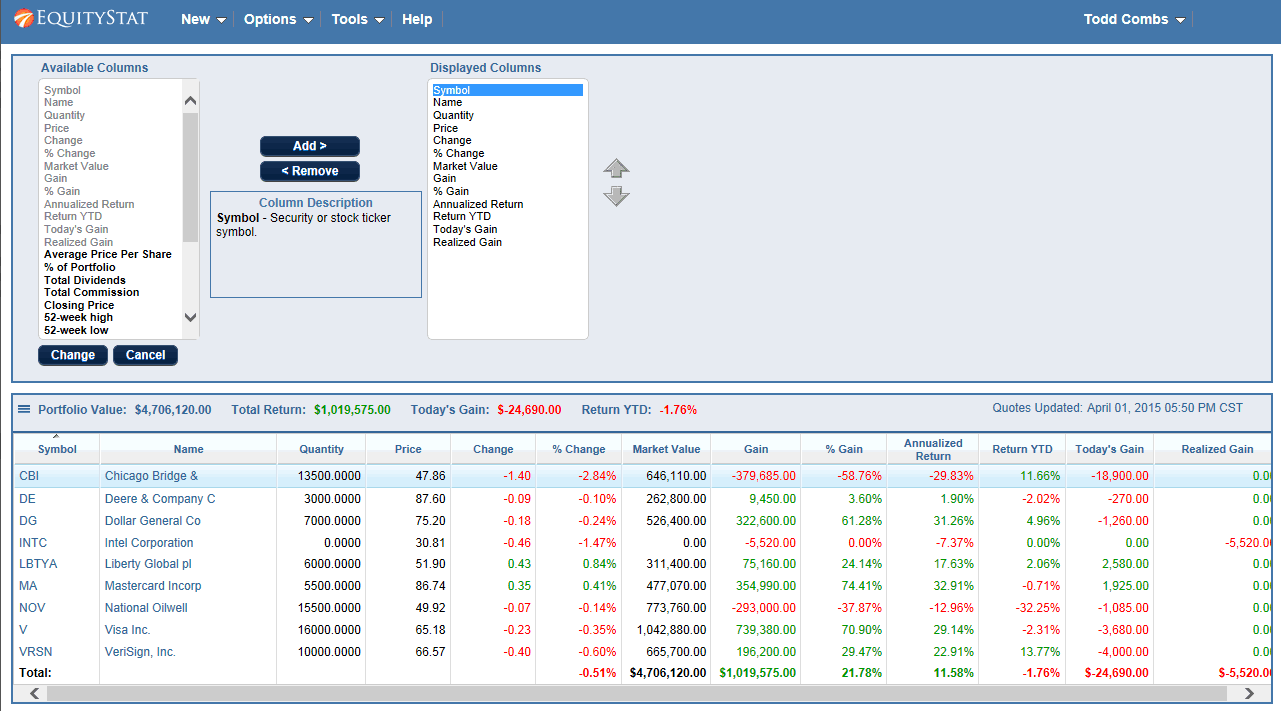
By default we display a pre-configured set of columns for your portfolio.  If you desire you can easily change the columns that are displayed in your portfolio.  To do this click the Options link at the top of your portfolio and choose the Change Columns menuitem.

Change Performance Metrics in EquityStat's Investment Portfolio Manager
Change Columns In Your Portfolio

Clicking the Change Columns menuitem will display a list of columns that are available and a list of columns your are currently using.  You can add and remove columns as well as change the order of your columns.  If you want a description of a column, just click on the column in either of the lists.

When you are finished change your columns, click the Change button to save your changes and get back to your portfolio.