Tracking dividend income across multiple accounts is one of the biggest challenges dividend investors face once their portfolio grows beyond a single brokerage. A few shares of one stock sitting in a taxable brokerage account, a retirement account, and a dividend reinvestment plan can each generate payouts on different schedules, and keeping an accurate picture of your total income becomes difficult fast.
Why Dividend Tracking Gets Complicated
Most investors do not start out with a complicated setup. They open one brokerage account, buy a handful of dividend paying stocks, and check their statement once a quarter. Over time, though, portfolios tend to spread out. A Roth IRA gets opened for retirement savings. An old 401k gets rolled into an IRA at a different provider. A dividend reinvestment plan is set up directly through a company. Each of these accounts pays dividends on its own schedule, and each one reports that income in a slightly different way.
Once you have three, four, or five accounts generating dividend payments, a simple mental tally is no longer enough. You need a system.
The Problem with Relying on Brokerage Apps Alone
Every brokerage offers some kind of dashboard showing dividends received in that account. The problem is that none of them show you the full picture. Your brokerage app can tell you what you earned in dividends at that one institution, but it has no way of knowing what your other accounts paid you. If you want your true total dividend income for the year, you are stuck adding numbers by hand from several different platforms, and that process only gets more error prone as your holdings grow.
Some investors try to solve this with a spreadsheet in Excel or Google Sheets. This works for a while, but building formulas to track dividends, capital gains, and reinvestments across several accounts takes real effort to set up, and it is easy for a spreadsheet like this to break or fall out of date as your portfolio changes.
How EquityStat Helps You Track Dividend Income
EquityStat was built to solve exactly this problem, and it is often considered the best dividend tracking app for investors juggling more than one account. Instead of piecing together numbers from different brokerages or maintaining your own spreadsheet, EquityStat gives you a single place to record and view your dividend income across every account you hold.
Record Every Type of Dividend Transaction
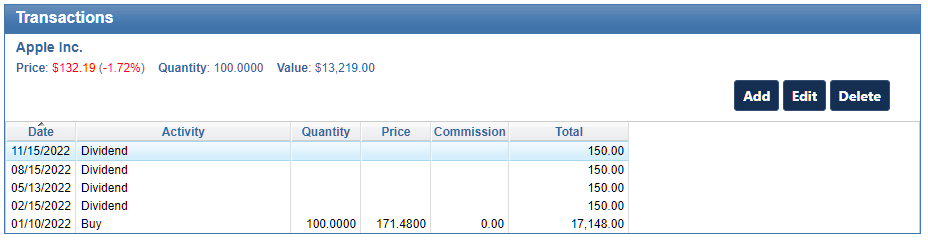
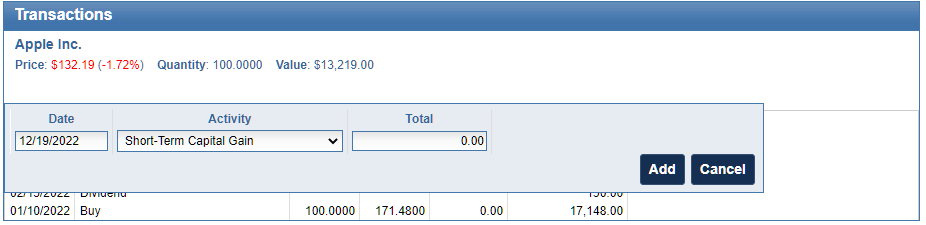
EquityStat lets you record dividend transactions in detail, not just as a lump sum. You can log dividends, short term capital gains, and long term capital gains separately, so your records reflect exactly what you were paid and how it will be treated at tax time. This level of detail matters, since dividends, short term gains, and long term gains are often taxed differently, and having them recorded separately from the start saves you from trying to sort it all out later.
For a full walkthrough, see how to track dividends and capital gains in EquityStat.
Record Reinvested Dividends and Capital Gains
If your dividends, short term capital gains, or long term capital gains are automatically reinvested rather than paid out in cash, EquityStat lets you record those reinvestments as well. This matters because reinvested payouts still count as income even though you never see the cash, and skipping them in your records will understate what you actually earned and can create confusion later when calculating cost basis.
See Your Dividend Growth in a Graph
The Portfolio Analysis page in EquityStat includes a graph showing how much you have received in dividends over time. You can view this graph at the portfolio level, which is useful for seeing how a single IRA or brokerage account is performing on its own, or at the full account level, which combines every portfolio and investment you hold into one overall trend. Seeing your dividend income laid out visually makes it much easier to spot growth, notice a dividend cut, or see the impact of a new position you added.
See Dividends Year to Date, This Quarter, Expected, and Total
The Portfolio Analysis page also breaks your dividend income down into figures that matter most to investors: dividends received year to date, dividends received this quarter, expected dividends based on your current holdings, and total dividends earned overall. Each of these is available at both the account level and the portfolio level, so you can see how one specific account is performing or view your income across everything you hold at once. Having expected dividends alongside your actual totals is especially useful for planning, since it gives you a sense of the income headed your way before it actually arrives.
Keep Your Dividend Records Ready for Tax Season
Once every account, every dividend, and every capital gain is recorded in one place, tax season becomes much less stressful. Rather than gathering forms from several institutions and trying to reconcile them by hand or rebuild a spreadsheet in Excel or Google Sheets, you already have a complete record of what you were paid, when you were paid it, and which account it came from.
Start Tracking Your Full Dividend Picture
Dividend income is one of the clearest signals of how your portfolio is actually performing, but only if you can see all of it at once. EquityStat brings every account, every dividend, and every capital gain into a single view instead of leaving you to add it all up yourself. See how EquityStat works and start tracking your dividend income across every account you hold.