The Complete Guide to Tracking Dividend Income Across Multiple Accounts

Tracking dividend income across multiple accounts is one of the biggest challenges dividend investors face once their portfolio grows beyond a single brokerage. A few shares of one stock sitting in a taxable brokerage account, a retirement account, and a dividend reinvestment plan can each generate payouts on different schedules, and keeping an accurate picture of your total income becomes difficult fast.

Why Dividend Tracking Gets Complicated

Most investors do not start out with a complicated setup. They open one brokerage account, buy a handful of dividend paying stocks, and check their statement once a quarter. Over time, though, portfolios tend to spread out. A Roth IRA gets opened for retirement savings. An old 401k gets rolled into an IRA at a different provider. A dividend reinvestment plan is set up directly through a company. Each of these accounts pays dividends on its own schedule, and each one reports that income in a slightly different way.

Once you have three, four, or five accounts generating dividend payments, a simple mental tally is no longer enough. You need a system.

The Problem with Relying on Brokerage Apps Alone

Every brokerage offers some kind of dashboard showing dividends received in that account. The problem is that none of them show you the full picture. Your brokerage app can tell you what you earned in dividends at that one institution, but it has no way of knowing what your other accounts paid you. If you want your true total dividend income for the year, you are stuck adding numbers by hand from several different platforms, and that process only gets more error prone as your holdings grow.

Some investors try to solve this with a spreadsheet in Excel or Google Sheets. This works for a while, but building formulas to track dividends, capital gains, and reinvestments across several accounts takes real effort to set up, and it is easy for a spreadsheet like this to break or fall out of date as your portfolio changes.

How EquityStat Helps You Track Dividend Income

EquityStat was built to solve exactly this problem, and it is often considered the best dividend tracking app for investors juggling more than one account. Instead of piecing together numbers from different brokerages or maintaining your own spreadsheet, EquityStat gives you a single place to record and view your dividend income across every account you hold.

Record Every Type of Dividend Transaction

EquityStat lets you record dividend transactions in detail, not just as a lump sum. You can log dividends, short term capital gains, and long term capital gains separately, so your records reflect exactly what you were paid and how it will be treated at tax time. This level of detail matters, since dividends, short term gains, and long term gains are often taxed differently, and having them recorded separately from the start saves you from trying to sort it all out later.

For a full walkthrough, see how to track dividends and capital gains in EquityStat.

Record Reinvested Dividends and Capital Gains

If your dividends, short term capital gains, or long term capital gains are automatically reinvested rather than paid out in cash, EquityStat lets you record those reinvestments as well. This matters because reinvested payouts still count as income even though you never see the cash, and skipping them in your records will understate what you actually earned and can create confusion later when calculating cost basis.

See Your Dividend Growth in a Graph

The Portfolio Analysis page in EquityStat includes a graph showing how much you have received in dividends over time. You can view this graph at the portfolio level, which is useful for seeing how a single IRA or brokerage account is performing on its own, or at the full account level, which combines every portfolio and investment you hold into one overall trend. Seeing your dividend income laid out visually makes it much easier to spot growth, notice a dividend cut, or see the impact of a new position you added.

See Dividends Year to Date, This Quarter, Expected, and Total

The Portfolio Analysis page also breaks your dividend income down into figures that matter most to investors: dividends received year to date, dividends received this quarter, expected dividends based on your current holdings, and total dividends earned overall. Each of these is available at both the account level and the portfolio level, so you can see how one specific account is performing or view your income across everything you hold at once. Having expected dividends alongside your actual totals is especially useful for planning, since it gives you a sense of the income headed your way before it actually arrives.

Keep Your Dividend Records Ready for Tax Season

Once every account, every dividend, and every capital gain is recorded in one place, tax season becomes much less stressful. Rather than gathering forms from several institutions and trying to reconcile them by hand or rebuild a spreadsheet in Excel or Google Sheets, you already have a complete record of what you were paid, when you were paid it, and which account it came from.

Start Tracking Your Full Dividend Picture

Dividend income is one of the clearest signals of how your portfolio is actually performing, but only if you can see all of it at once. EquityStat brings every account, every dividend, and every capital gain into a single view instead of leaving you to add it all up yourself. See how EquityStat works and start tracking your dividend income across every account you hold.

Monster Beverage Is Splitting 2-for-1 on Aug. 11

Monster Beverage (NASDAQ: MNST) is splitting its stock 2-for-1, with shares beginning to trade at their new, split-adjusted price on August 11, 2026. Shareholders of record as of July 24 will see the additional shares credited to their accounts after the market closes on August 10. It is not the company’s first split. Monster’s share price has climbed substantially over the years, and splits like this one are typically how a company keeps its per-share price more accessible as growth continues.

What the Split Actually Means for Shareholders

A 2-for-1 split doubles your share count and roughly halves the price per share, but it does not change the total value of your position. If you owned 100 shares of Monster before the split, you’ll own 200 shares afterward, at approximately half the per-share price. Your overall stake in the company is unchanged, only the number of shares and the price tag on each one are different.

Why You Still Need to Record It

Even though a split does not change what your position is worth, it does change your share count and your cost basis per share going forward. If a split is not recorded in your stock portfolio tracker, your holdings will show the wrong number of shares and an inflated cost basis, which throws off both your ongoing performance numbers and your eventual capital gains calculations when you sell.

How to Record the Split in EquityStat

Recording a split in EquityStat takes just a few steps – select the stock, add a new transaction, choose Split as the activity type, and enter the split ratio, 2 for 1 in Monster’s case. EquityStat then automatically adjusts your share count and cost basis for every prior transaction on that stock.

For the full walkthrough with screenshots, see our guide on how to record a stock split in EquityStat, which covers the exact steps using Tesla’s split as a worked example. The same process applies to Monster Beverage, or any other stock split, regardless of the ratio.

Why You Can’t See Your Real Investment Performance From Any Single Brokerage App

Open your brokerage app right now and it will tell you exactly how that account is doing. What it won’t tell you is how you’re doing. If you also have a 401(k) with a former employer, an IRA at a different provider, or a handful of mutual funds bought years ago, your brokerage app has no idea any of that exists. It’s not being unhelpful, it simply can’t see outside its own walls. That’s the core problem with trying to understand your investment performance one account at a time, and it’s the reason a dedicated stock portfolio tracker exists in the first place.

Every Brokerage App Has the Same Blind Spot

Brokerage apps are built to serve one purpose, help you manage the money that is inside that specific brokerage. Fidelity’s app knows about your Fidelity account. Schwab’s app knows about your Schwab account. Neither one has any visibility into the other, and neither has any reason to build that visibility, since it isn’t their job to help you understand your finances outside their platform.

That means every number you see in a brokerage app, your return, your gain, your dividend income, is only ever a partial answer. If you’re checking three or four different apps to get a sense of where you stand, you’re not actually looking at your investment performance. You’re looking at fragments of it, and doing the aggregation yourself, in your head, imperfectly.

What You Actually Can’t See Without Aggregating

A few specific numbers are simply impossible to calculate from any single account:

  • Total return across everything you own. A single brokerage can tell you its own return, but not your blended return once a 401(k), an IRA, and a taxable brokerage account are all factored in together.
  • Combined dividend income. If you own dividend-paying stocks in more than one account, no single provider can show you your total dividend income for the year. Only a dedicated stock dividend tracker that pulls every account together can do that.
  • True asset allocation. Your brokerage app might show you’re well-diversified within that account, while you’re unknowingly overexposed to a single sector once your 401(k) holdings are counted too.
  • Overall net worth. Net worth isn’t a brokerage feature, it’s an aggregation problem. It only exists once every account, brokerage, retirement, and otherwise, is added together.
  • Which of your accounts is actually performing best. Without a side-by-side comparison, there’s no way to know whether your IRA, your brokerage account, or your old 401(k) is doing the heavy lifting, or dragging down your results.

None of these are edge cases. They’re the basic questions any investor eventually wants answered, and none of them can be answered by a tool that only sees one piece of the puzzle.

Why a Spreadsheet Doesn’t Really Solve It Either

The obvious workaround is to build a spreadsheet in Excel or Google Sheets and update it yourself. In practice, this breaks down quickly. Prices need to be looked up and re-entered by hand. Returns have to be recalculated with every trade. Dividends have to be logged manually as they arrive. It is not that a spreadsheet in Excel or Google Sheets cannot hold the data, it is that keeping it accurate becomes a part-time job.

A proper stock portfolio tracker application solves the maintenance problem specifically. It pulls current prices automatically and recalculates your returns as soon as you log a transaction, so the aggregated view stays accurate without you having to rebuild it every time something changes, the way you would need to in an Excel or Google Sheets file. You still enter your own trades and holdings, the same way you would in a spreadsheet, but the tracker takes over everything else, the pricing, the math, and the performance calculations.

What a Real Stock Portfolio Manager Should Show You

A tool built specifically to solve this problem, rather than a brokerage app that happens to show you a balance, should be able to answer the questions your individual accounts can’t:

  • Consolidated performance metrics. Gain, quarterly return, year-to-date return, and annualized return, calculated across your full portfolio, not just one account at a time.
  • Benchmark comparisons. The ability to see whether your overall strategy is beating, matching, or underperforming the S&P 500, Dow Jones, or Nasdaq, something no single brokerage account can tell you in isolation.
  • Dividend tracking at every level. Dividend income visible per investment, per portfolio, and across your entire account, so you always know your true income from holdings, not just the ones in one place.
  • Historical view. The ability to see what your full portfolio looked like on a past date, useful for reviewing performance over time or preparing for tax season.
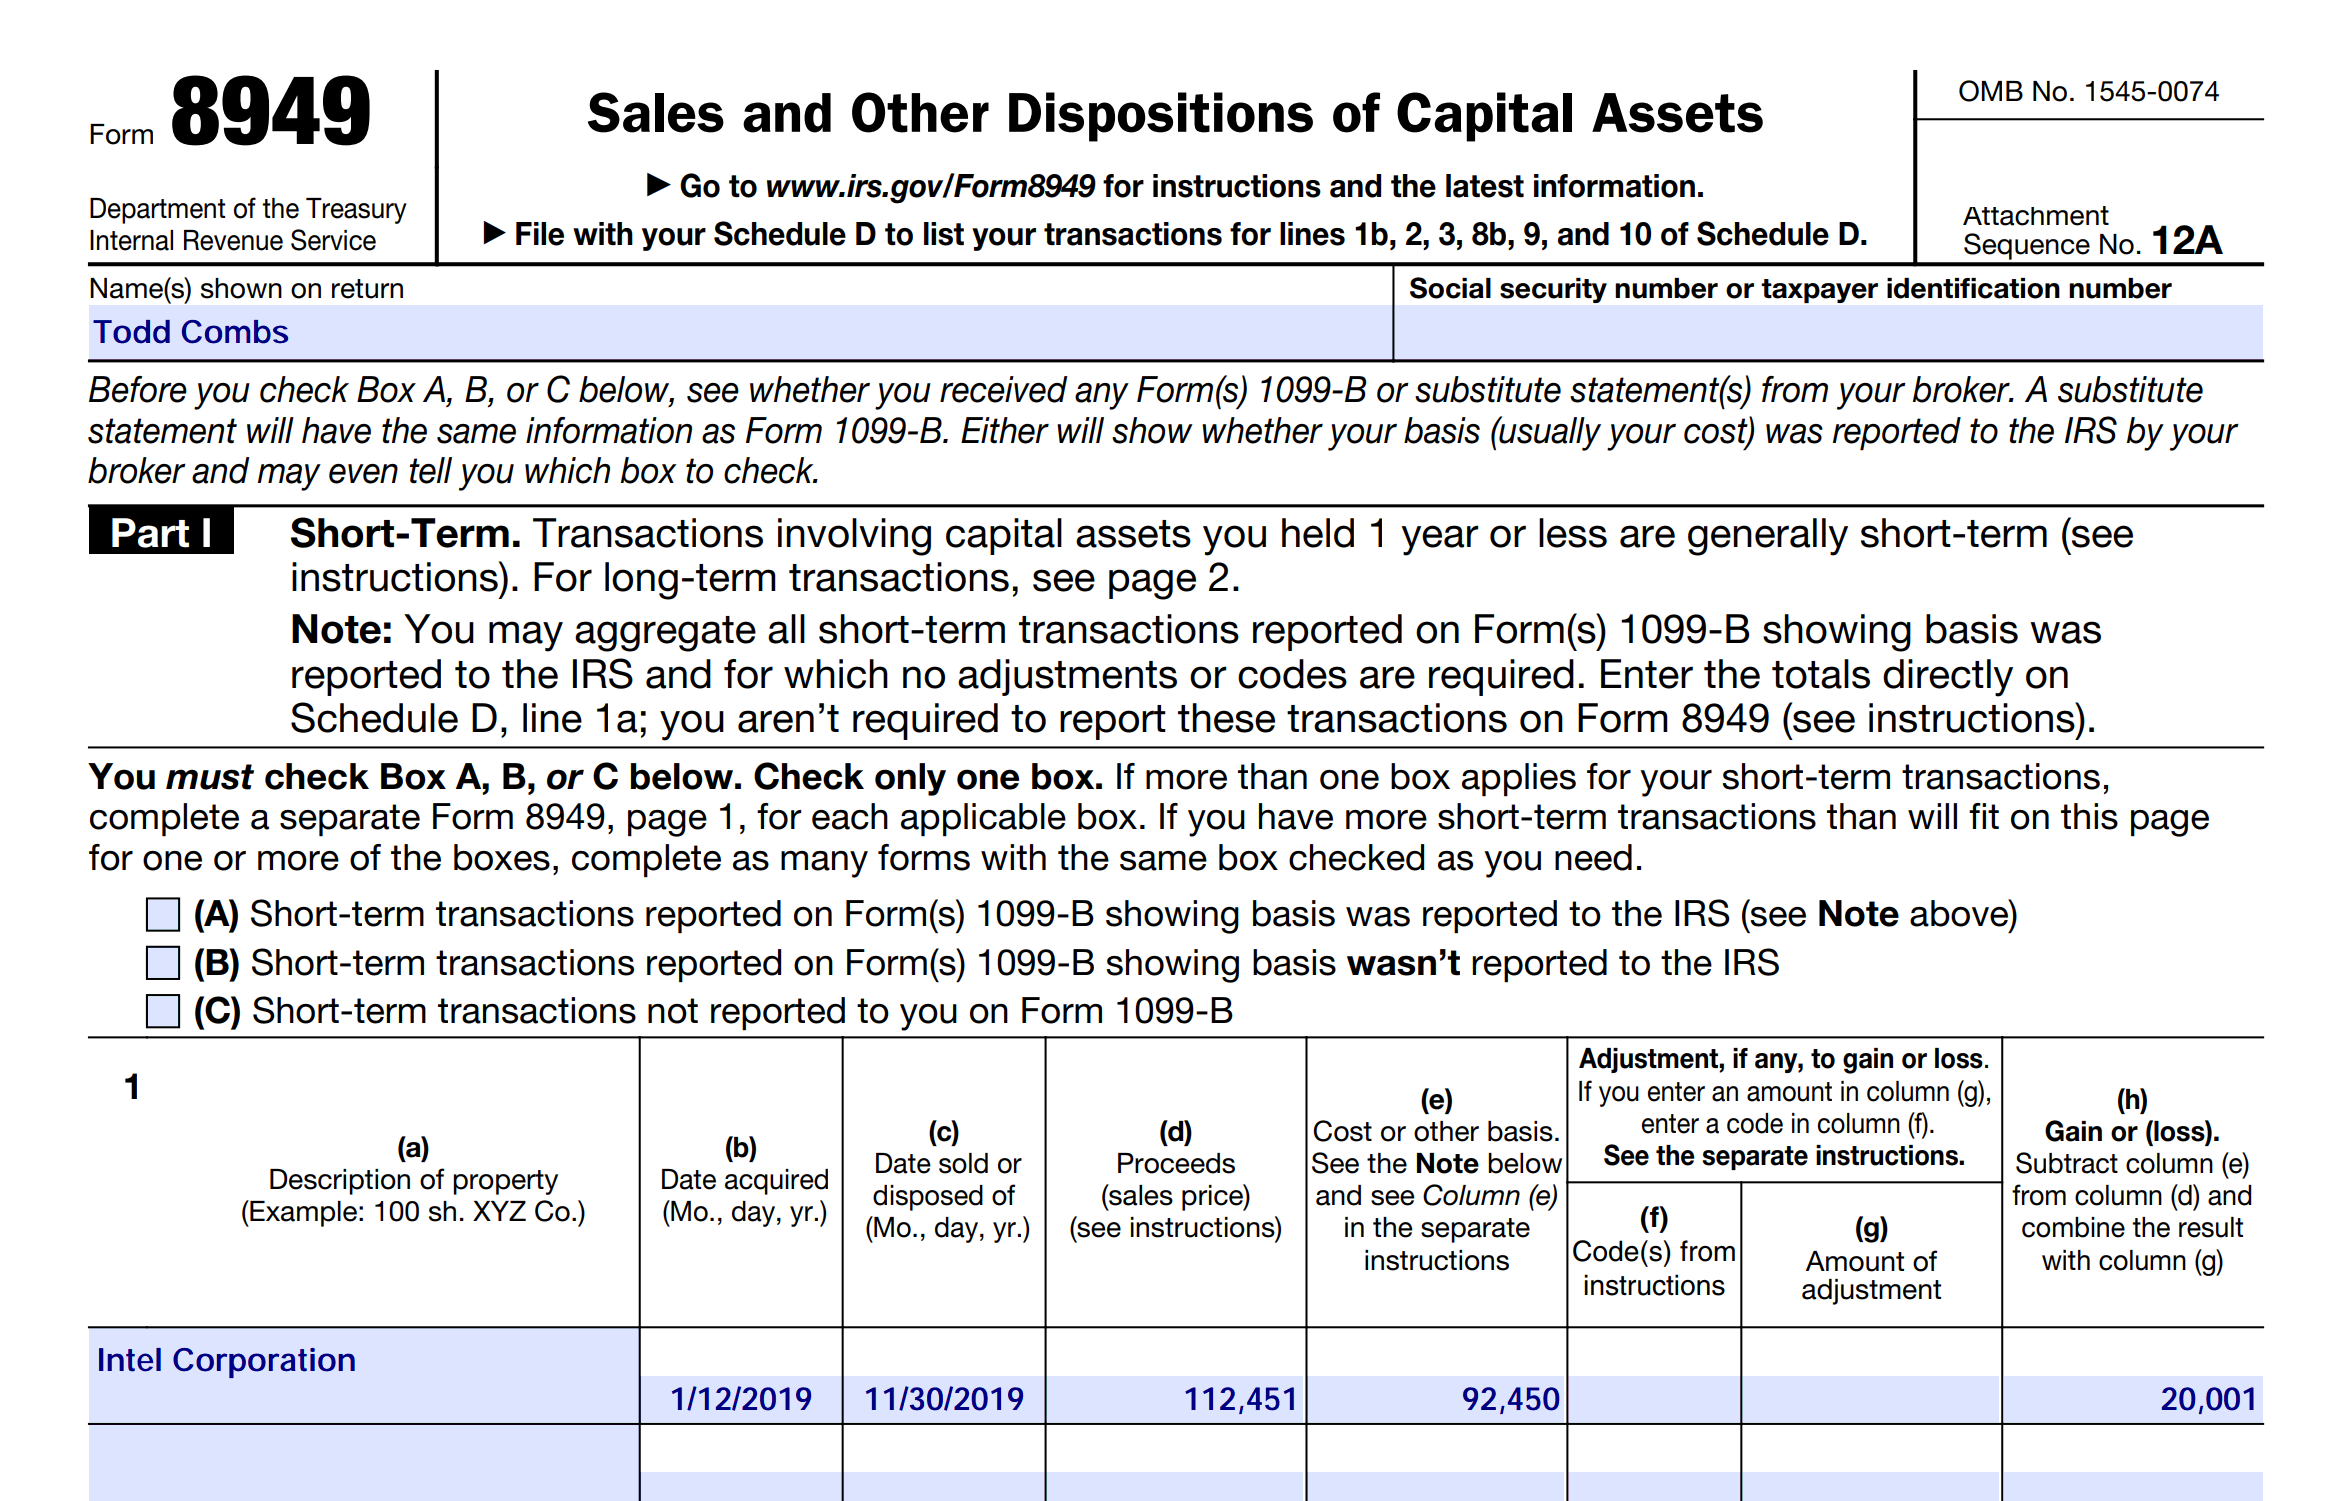
  • Tax reporting that spans everything you sold. When it’s time to file, a consolidated tracker can generate IRS Form 8949 covering every sale across every account, calculating your long-term and short-term gains and losses so you can hand the report straight to your accountant.

This is the same reasoning EquityStat was built around from the start, investors who were managing their own money got tired of tools that could only see one slice of it, and built something that could see all of it instead.

The Real Cost of Not Aggregating

The risk of checking accounts separately isn’t just inconvenience, it’s blind spots that compound over time. An investor might feel diversified because each individual account looks reasonable, while their combined holdings are quietly concentrated in one sector or a handful of overlapping funds. Or they might underestimate how much they’re actually earning in dividends because it’s split across three accounts and never added up. Or they simply won’t know, in any given year, whether their overall strategy is working, because “overall” was never actually calculated.

None of these are dramatic failures. They’re just the slow cost of never having the full picture, and they’re avoidable the moment every account gets pulled into one place.
Frequently Asked Questions

Why can’t my brokerage app show me my total portfolio performance? Because it only has visibility into the account it manages. It has no data about your other brokerage accounts, your 401(k), or your IRA, so it can only ever report on its own slice of your investments.

Is a spreadsheet in Excel or Google Sheets a good enough substitute for a portfolio tracker? A spreadsheet in Excel or Google Sheets can hold the data, but keeping prices, returns, and dividends current requires ongoing manual work. A dedicated stock portfolio tracker automates the pricing and performance calculations, so the aggregated view stays accurate without constant upkeep.

What accounts should I include when tracking my investment performance? Every account that holds investments, brokerage accounts, 401(k)s, IRAs, and mutual funds, should be included. Leaving any of them out means your total return, dividend income, and asset allocation numbers will all be incomplete.

Can I see my net worth using a stock portfolio tracker? Yes, as long as the tracker supports multiple account types. Net worth is fundamentally an aggregation calculation, so it depends on having every account represented in one place rather than checked separately.

Getting Started with EquityStat: A Quick Setup Guide For Your Stock Portfolio Tracker

Setting up EquityStat takes just a few minutes, and once your first investment is entered, you’ll have a working stock portfolio tracker you can build on. This quick getting started guide walks through adding your first investment, understanding your portfolio view, entering additional transactions, and keeping your portfolio organized as your holdings change over time.

Add Your First Investment

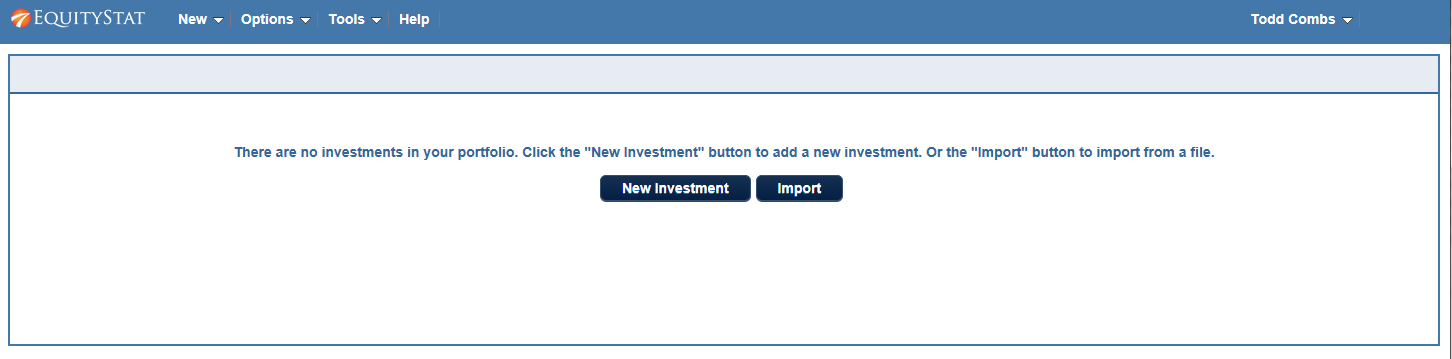
After you join EquityStat, you’ll be logged into your account. Since you won’t have any investments yet, you’ll see an empty portfolio screen. From here, click the New Investment button to add your first holding.

EquityStat Stock Portfolio Directions

Add transactions to EquityStatClicking New Investment opens a dialog where you can enter a buy transaction. Enter the symbol of the investment, the date of purchase, the number of shares purchased, and the price per share, then click Save. Once your first purchase is entered, you can go on to add other transactions for that same investment, including additional buys, sells, and dividends.

Understanding Your Portfolio View

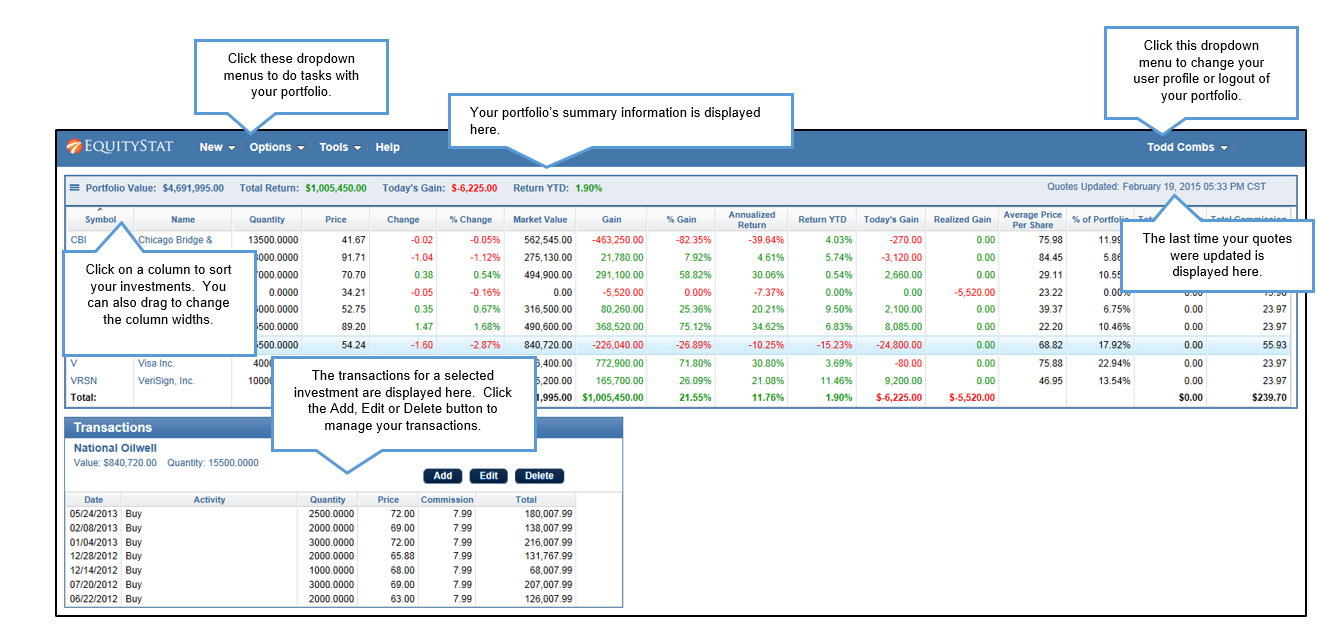
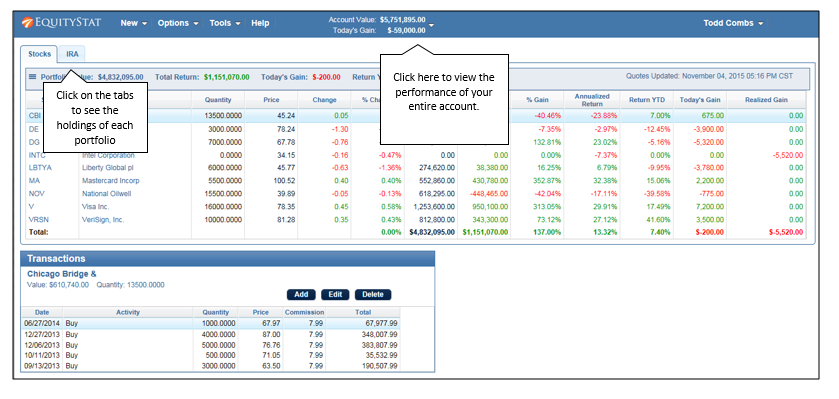
Once you’ve added a few investments, your portfolio view will look something like the example below.

Getting Start With EquityStat Portfolio Tracker
Directions on EquityStat’s Portfolio Manager

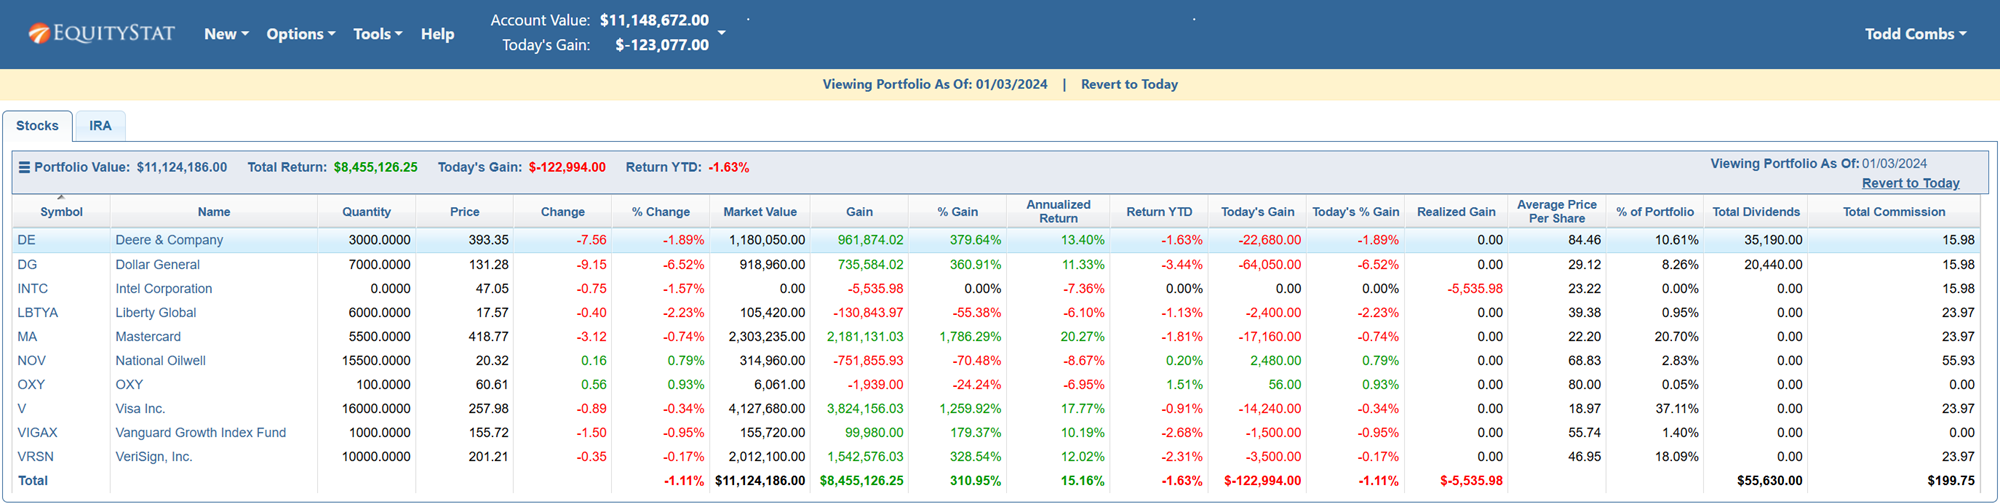
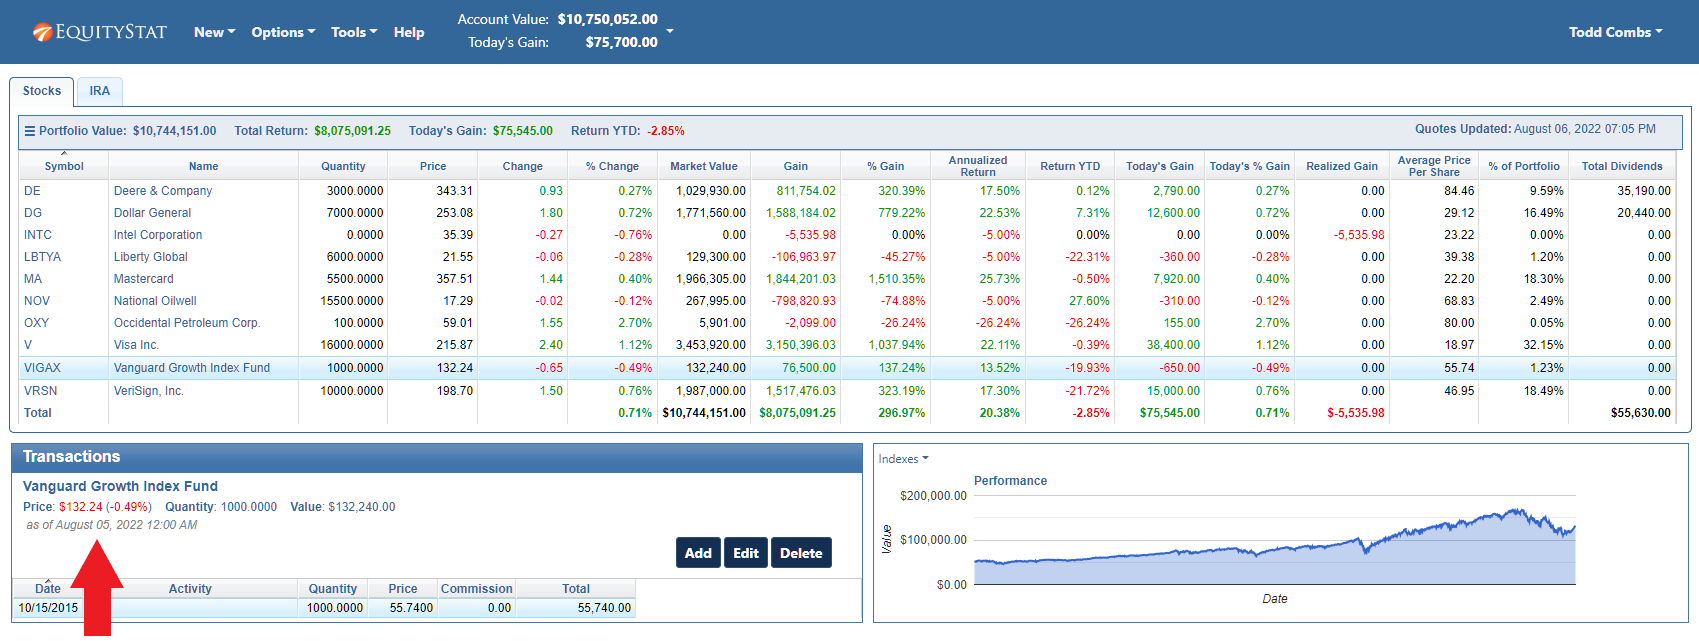
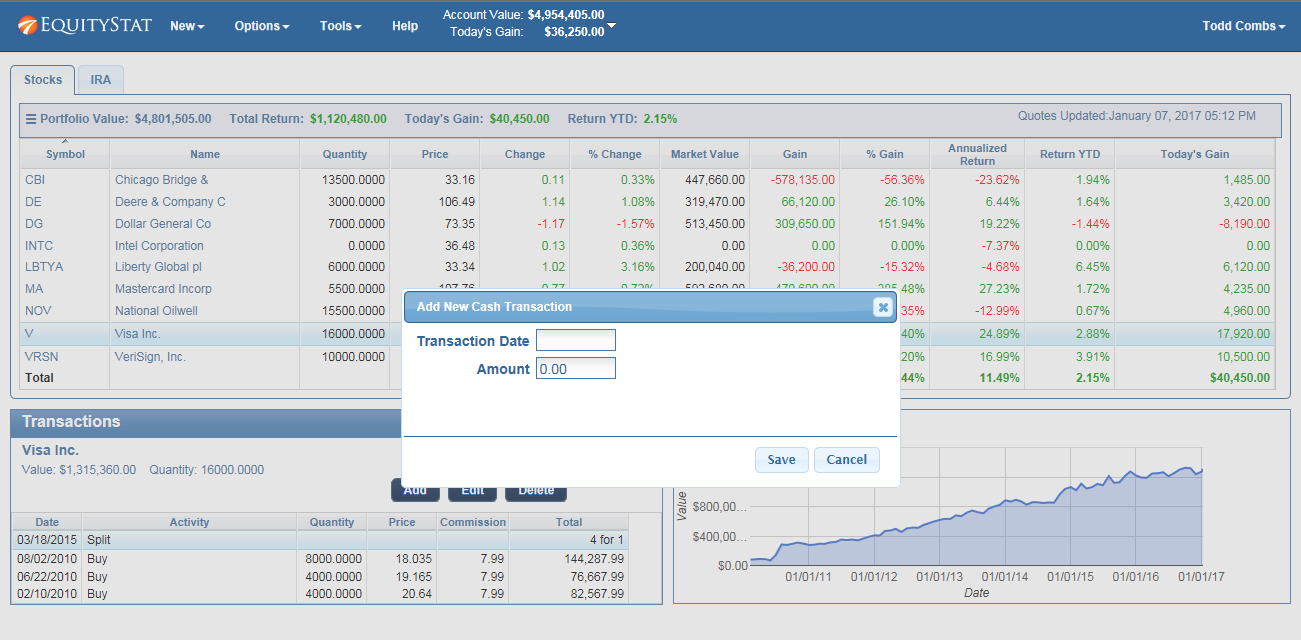
The top table lists all of your investments along with key performance metrics and data about each investment. Below it, you’ll see the transactions for whichever investment is currently selected. You can sort your investments and transactions by clicking any column heading, and you can widen a column by dragging its border. Above the investment table, a summary section shows your total portfolio value, total dollar return, day’s gain or loss, and year-to-date return, giving you an at-a-glance read on how your stock portfolio manager sees your overall performance.

Add Transactions to EquityStat's Investment Portfolio
How to add transactions to EquityStat

Adding More Investments

As your portfolio grows, you’ll need to log new investments and additional transactions.

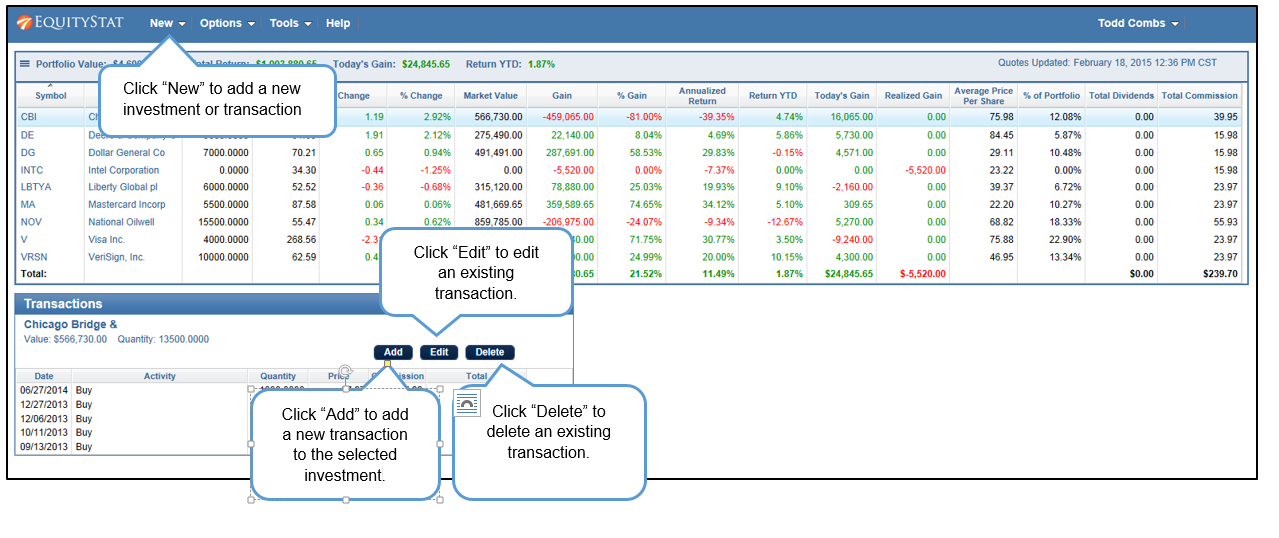
To add an investment that isn’t in your portfolio yet, click the New menu and choose New Investment. To add a transaction to an investment you already hold, go to the transaction table below the investment table and click Add. A new row appears where you can record a buy, sell, dividend, or one of several other transaction types. You can edit an existing transaction by selecting it and clicking Edit, or remove one entirely with the Delete button. If you’re moving a large number of trades in at once, it’s often faster toImport your transactions from a csv file into EquityStat instead of entering them one at a time.

Hiding Sold Investments

Once you’ve sold out of a position entirely, you may not want it cluttering your active portfolio view.

Click the three-line icon on the left and choose Hide Sold Investments to remove fully sold holdings from view. To bring them back at any point, for example when you’re reviewing past performance, click the icon again and choose View Sold Investments.

Frequently Asked Questions

How long does it take to set up EquityStat? Adding your first investment takes less than a minute. A full portfolio with multiple holdings can typically be built out in under 15 minutes.

Can I import my existing transaction history instead of entering it manually? Yes. If you’re already tracking your investments elsewhere, you can import your transaction history from a Import your transactions into EquityStat rather than re-entering everything by hand.

What if I sell all of an investment, can I still see its history? Yes. Sold investments can be hidden from your active view to reduce clutter, but you can bring them back into view at any time to review their full history.

Who Is EquityStat, What Does It Do, and Why Do You Need It?

Most investors don’t have one account. They have a brokerage account, maybe a 401(k) from work, an IRA, a handful of mutual funds picked up over the years. Each one lives on a different platform, with a different login, showing a different slice of the picture, and none of them show the whole thing. EquityStat exists to answer a simple question: what if you could see all of it in one place?

Who is EquityStat?

EquityStat is a stock portfolio tracker built by investors, for investors. It wasn’t designed by a bank or a brokerage trying to keep you inside their ecosystem, but was built instead by people who were managing their own investments and got tired of the tools available to them. That distinction matters. A stock portfolio manager built by someone with a brokerage relationship to protect has a reason to keep your data siloed. A stock portfolio tracker application built by investors, for investors, doesn’t, since its only job is to give you an accurate, complete view of what you own.

That independence is also why EquityStat doesn’t ask for your brokerage passwords or sell your information. You enter your own holdings and transactions, and the platform’s only incentive is to represent them accurately. It’s a meaningfully different relationship than tools built around monetizing your financial data.

EquityStat’s reputation has grown the same way most trustworthy financial tools do: one investor at a time, through word of mouth and results. Customers describe it as more complete than their brokerage’s own software, better than other trackers they’d tried, and easier to log into than jumping through their broker’s site. That kind of comparative praise, from people who tried alternatives first, carries real weight. It’s also drawn outside recognition: Kiplinger’s Personal Finance featured EquityStat in a 2024 roundup of tools for do-it-yourself stock investors, specifically as a pick for portfolio tracking.  You can read the full Kiplinger Magazine names EquityStat a top stock portfolio manager.

What is EquityStat?

EquityStat is a stock portfolio tracker application that consolidates every investment account you have, including brokerage accounts, 401(k)s, IRAs, and more, and every asset type you hold in them, including stocks, bonds, ETFs, and mutual funds, into a single dashboard. Instead of multiple logins and multiple different partial pictures, you get one.

Once your accounts are in, EquityStat goes well beyond just listing what you own. As a full stock portfolio manager, it calculates gain, quarterly return, year-to-date return, and annualized return for each holding, portfolio, and account. It works as a dedicated stock dividend tracker, logging dividends down to the individual investment level, and it lets you record buys, sells, and splits for each holding. You can even go back in time and see exactly what your portfolio looked like on any past date, something a spreadsheet or a single brokerage login simply can’t do across accounts.

On the analysis side, EquityStat delivers summary performance graphs, individual investment performance graphs, and benchmark comparisons against the S&P 500, Dow Jones, and Nasdaq, at the account level, the portfolio level, or drilled down to a single holding. It also generates IRS Form 8949 and calculates cost basis, gains, and losses, so tax season doesn’t mean reconstructing a year of transactions by hand.

And because it’s built for how people actually check their investments, it’s accessible on desktop, tablet, or smartphone, with a responsive interface you can customize, choosing which metrics and columns display, and sorting holdings or transactions by the order that works best for you.

Why EquityStat?

Here’s the core problem EquityStat solves: if your investments are spread across multiple accounts, you cannot actually see your real financial picture without aggregating them somewhere. Your brokerage app only knows about your brokerage account. Your 401(k) provider only knows about your 401(k). Neither one can tell you your total return across everything you own, your combined dividend income, or how your overall asset allocation looks once every account is counted together. That picture only exists if something pulls all the pieces into one place, and that’s exactly what a good stock portfolio tracker is for.

This is the reason a spreadsheet isn’t really a solution, either. Building one manually means looking up prices by hand, recalculating returns yourself, and updating the whole thing every time you make a trade. EquityStat handles the price side of that automatically, pulling current stock, mutual fund, and ETF quotes and recalculating your returns in real time, so once you’ve logged a trade, your performance numbers stay current without any extra work.

The payoff is real financial clarity. When every account rolls up into one stock portfolio manager, you can finally answer the questions that actually matter: Is my overall net worth going up? Which of my accounts is actually performing best? How much am I really earning in dividends across everything I own? Am I overexposed to one sector once you count my 401(k) alongside my brokerage account? None of those questions can be answered by looking at accounts one at a time, they require aggregation, which is the entire reason EquityStat exists.

For investors who’ve been checking three or four different logins just to get a partial sense of where they stand, that single consolidated view is the difference between managing your investments and merely monitoring pieces of them. That’s why EquityStat is built the way it is, as one place to aggregate everything, so you always know exactly where you stand.

Frequently Asked Questions

Who built EquityStat? EquityStat was built by investors who were managing their own portfolios and found the available tracking tools incomplete.

What accounts can EquityStat track? Brokerage accounts, 401(k)s, IRAs, and other account types can all be tracked side by side, and organized into separate portfolios if you want to keep them distinct.

Why do I need to aggregate my investment accounts in one place? Because no single brokerage or plan provider can show you your total return, combined dividend income, or overall asset allocation across accounts they don’t have visibility into. Only a consolidated stock portfolio tracker can show you that complete picture.

Has EquityStat been reviewed by any outside publications? Yes. Kiplinger Magazine names EquityStat a top stock portfolio tracker covering top tools for DIY stock investors, specifically recommending it as a portfolio tracker.

EquityStat Named a Top Tool for DIY Investors by Kiplinger Magazine

A Trusted Recommendation for Individual Investors

Kiplinger Magazine Names EquityStat A Great Tool For DIY Investors

Kiplinger Magazine, one of the most respected names in personal finance, recently recognized EquityStat as one of the top tools for DIY stock investors. To build their list, Kiplinger consulted seasoned investors and long‑time Wall Street observers, selecting only platforms that deliver real value, clarity, and actionable insights.

Their verdict: EquityStat stands out as a powerful, easy‑to‑use portfolio tracking software for everyday investors.

Why Kiplinger Highlighted EquityStat

In their review of top investing tools, Kiplinger emphasized several strengths that make EquityStat especially useful for self‑directed investors:

1. Fast, Simple Portfolio Setup

Kiplinger noted that EquityStat makes it incredibly easy to build a stock‑tracking portfolio. Investors can add holdings quickly, organize multiple portfolios, and start analyzing performance in minutes, without the clutter or complexity found in many other tools.

2. Robust Performance Metrics

According to Kiplinger’s analysis, EquityStat provides a wide range of performance indicators that help investors understand how their stocks, ETFs, and mutual funds are truly performing. These include:

  • Daily gain/loss
  • Total return
  • Annualized return
  • Realized gains
  • Cost basis
  • Long‑term performance trends

These metrics give DIY investors the clarity they need to make informed decisions.

3. Clean, Intuitive Interface

Kiplinger also praised EquityStat’s clean, streamlined design. The interface avoids unnecessary distractions and focuses on what matters most: clear data, easy navigation, and fast access to performance insights.

Why This Recognition Matters

Being named one of Kiplinger’s top tools reinforces what many investors already know: EquityStat is a reliable, transparent, and user‑friendly platform for tracking investments.

For individual investors, especially those managing their own portfolios without an advisor, having a tool that is both powerful and easy to use is essential. Kiplinger’s endorsement highlights EquityStat’s ability to deliver exactly that.

You can read the article here.

https://www.kiplinger.com/investing/great-tools-for-diy-stock-investors

Explore Your Past Portfolio Performance with EquityStat’s “View On Date” Feature

Investing is not just about tracking today’s number, it’s about understanding your portfolio’s journey over time. That’s why EquityStat, your all-in-one stock portfolio tracker, is excited to introduce a powerful new feature: View On Date. Now, you can look back at your holdings and portfolio performance on any past date, giving you deeper insight into your investment strategy.

Introducing “View On Date”

The View On Date feature allows you to examine your portfolio exactly as it appeared on a specific past date. When you select a past date:

  • Only the investments you held on that date will be displayed.
  • Performance metrics are calculated using the closing prices from that date, giving you an accurate snapshot of your historical portfolio performance.

Whether you’re reviewing historical performance, analyzing past trades, or comparing growth over time, this tool gives you precise insight into your investment history.

How to Use “View On Date”

View your EquityStat stock portfolio on a past date.
  1. Via the Options Menu:
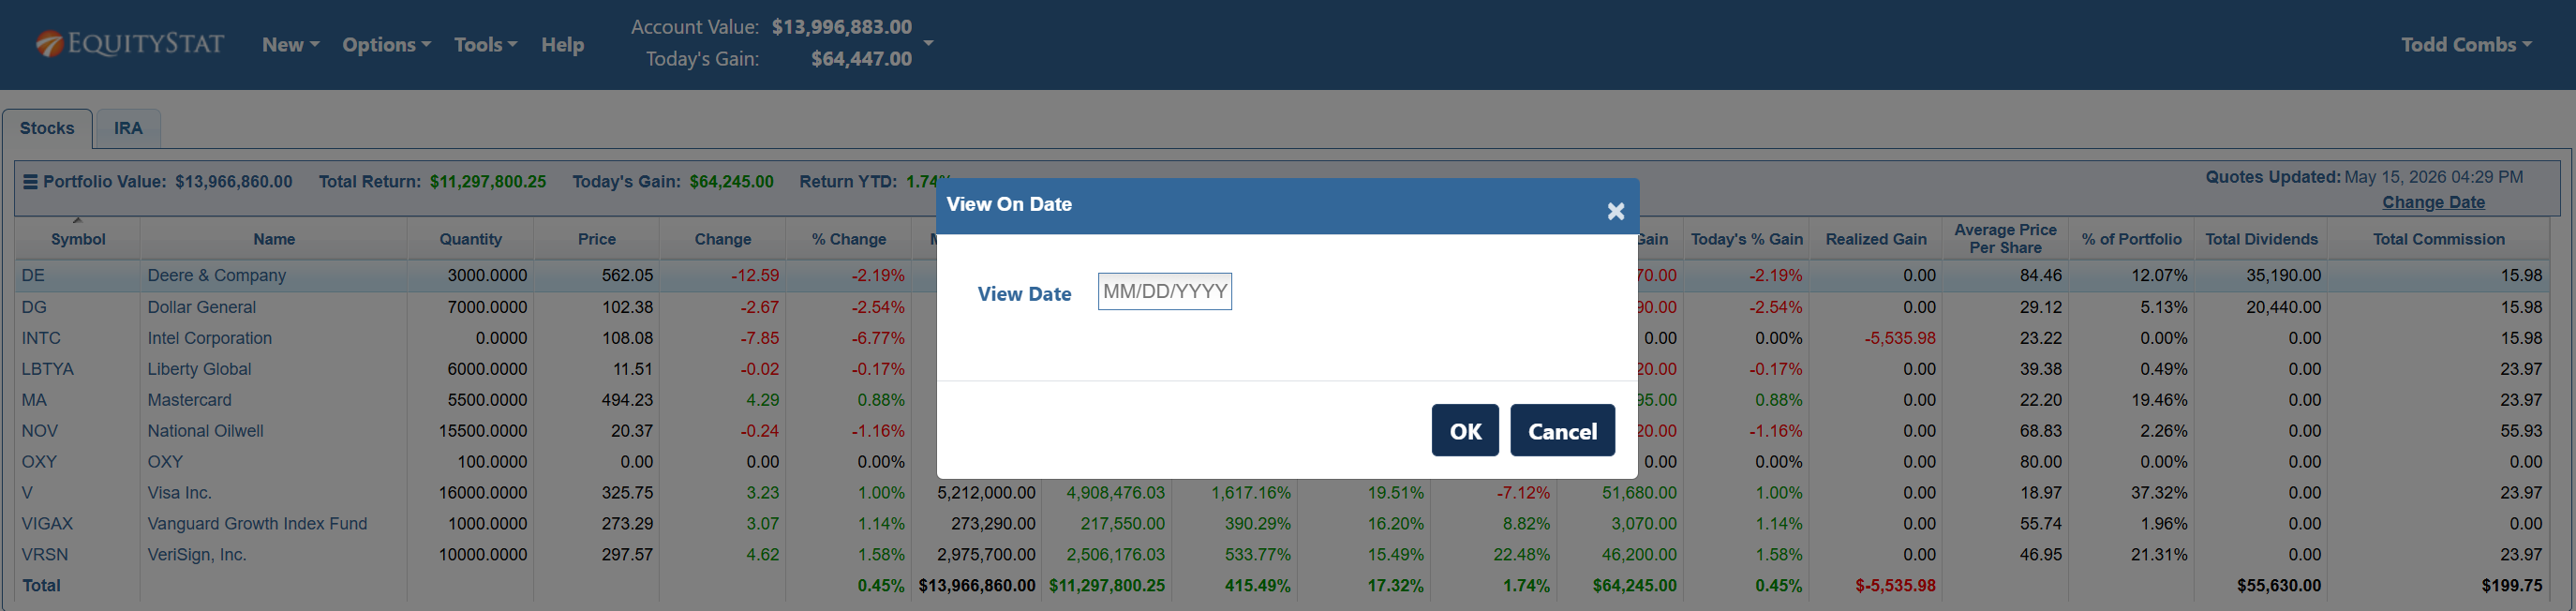
    • Click the Options menu at the top of your portfolio dashboard.
    • Select View On Date from the dropdown.
    • Enter the past date you want to review in the dialog box.

  2. Using the Change Date Link:
    • Underneath the “Quotes Updated” date, click Change Date to select a past date.

  3. Portfolio Analysis for Past Dates:
    • In the upper right-hand corner of your portfolio dashboard, click the View On Date link to access historical portfolio analysis.

Once you’re viewing your portfolio on a past date, a banner message at the top of the page will show the date you’re analyzing. To return to your current holdings, simply click Revert To Today.

View your EquityStat stock portfolio on a past date.

Why Investors Will Love This Feature

  • Historical Insights: Understand how your portfolio has performed over weeks, months, or even years.
  • Performance Analysis: Evaluate the impact of past decisions to refine your investment strategy.
  • Simplified Tracking: No more manual tracking or spreadshee, see past performance directly in EquityStat.

This feature makes EquityStat not just a real-time portfolio tracker, but a historical analysis tool that empowers investors to make smarter decisions.

Start Exploring Your Portfolio History Today

With EquityStat’s View On Date feature, you have complete control over your portfolio insight, past, present, and future. Stay informed, track your progress, and make confident investment decisions all from a single platform.

2025 IRS Form 8949: How to Quickly Generate Your Capital Gains Report with EquityStat

If you sold stocks, ETFs, mutual funds, or other investments during 2025, you’ll need to report your gains and losses on IRS Form 8949 when filing your 2025 tax return. To make this process faster and more accurate, EquityStat now provides an automated Form 8949 generator.

What Is IRS Form 8949?

IRS Form 8949 is the official document used to report:

  • Short‑term capital gains and losses (assets held for one year or less)
  • Long‑term capital gains and losses (assets held for more than one year)

If you sold any taxable investment in 2025, including stocks, mutual funds, ETFs, this form will help your tax preparer produce your tax return.

Generate tax form 8949 with EquityStat

Generate Your 2025 Form 8949 Automatically in EquityStat

EquityStat’s updated tools now support instant creation of the 2025 Form 8949, helping you avoid manual calculations and spreadsheet errors.

How to Generate Form 8949 in EquityStat

  1. Open the Tools menu in your EquityStat dashboard
  2. Select Generate IRS Form 8949
  3. Choose the tax year you want to generate Form 8949 for
  4. Click Generate on the Form 8949 page

Within seconds, EquityStat calculates:

  • Short‑term gains and losses
  • Long‑term gains and losses
  • Adjusted cost basis
  • Totals required for Schedule D

A PDF formatted exactly to IRS specifications is created and ready for download.

What You Can Do With Your Generated Form 8949

Your completed PDF can be:

  • Uploaded directly into your tax software
  • Sent to your accountant or tax preparer
  • Printed and included with a paper tax return

This ensures your capital‑gains reporting is complete, accurate, and compliant.

Why Investors Choose EquityStat for Form 8949

EquityStat is built for both high‑volume traders and long‑term investors who want reliable tax reporting. Key benefits include:

  • Accurate cost‑basis tracking
  • Automatic gain/loss calculations
  • Fast PDF generation
  • Support for stocks, ETFs, and mutual funds
  • Ideal for 2025 tax‑filing deadlines

Who Should Generate Form 8949?

You should create Form 8949 if you:

  • Sold stocks or ETFs in 2025
  • Sold mutual funds or index funds
  • Need a clean, IRS‑ready summary of gains and losses

If you had any investment sales in 2025, EquityStat’s Form 8949 generator saves time and reduces the risk of filing errors.

Example: What Your Form 8949 Output Includes

Your generated PDF contains:

  • Part I: Short‑term transactions
  • Part II: Long‑term transactions
  • Totals for gains and losses
  • IRS‑compliant formatting and layout

This ensures your tax return is complete and ready for submission.

How to Track Dividends and Capital Gains in Your Stock Portfolio

Dividends and capital gains distributions land in your brokerage accounts all year long, but they tend to pile up at the end of the year, when mutual funds and ETFs make their final payouts. If you are not keeping track of them as they come in, it is easy to lose sight of how much income your portfolio is actually producing. It is even easier to end up hunting for numbers when tax season arrives.

EquityStat’s stock portfolio tracker makes it simple to record and monitor dividends, short term capital gains, and long term capital gains across every brokerage account you own, all from one screen

Why Tracking Dividends and Capital Gains Matters

Your brokerage’s website will show you dividends and gains for that one account. Most investors, though, hold assets in more than one place. Maybe you have a 401k through work, a taxable brokerage account you manage yourself, and an IRA somewhere else entirely. Look at any single one of those accounts and you are only ever seeing part of the story.
Keeping this information in one place helps in a few ways. You get an honest picture of how much dividend and capital gains income your whole portfolio produced this year, not just what one brokerage happens to report. You also make tax season easier on yourself, since short term and long term gains are taxed differently and it helps to know which is which well before your 1099s show up. And you get a truer read on how your investments are actually performing, since total return includes dividends and distributions, not just the change in share price.

Dividends vs Short Term vs Long Term Capital Gains

It helps to know which category a distribution falls into before you record it.

Dividends are cash payments a company or fund makes to its shareholders, usually out of earnings.

Short term capital gains come from an investment held for one year or less before it is sold. For mutual funds, this can also include short term gains the fund realized internally and passed along to you as a shareholder.

Long term capital gains come from an investment held for more than a year, and they are generally taxed at a lower rate than short term gains.

Mutual funds and ETFs often distribute some combination of all three at year end, which is exactly why it helps to use a tracker that keeps them separated clearly instead of lumping everything together.

How to Record Dividends and Capital Gains in EquityStat

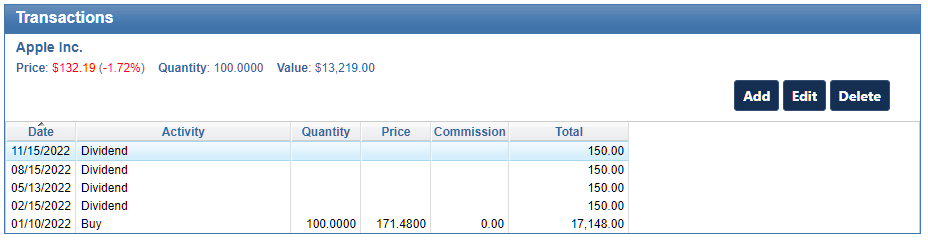
EquityStat transaction panel showing how to add a dividend or capital gain to a stock portfolio
Transaction Panel Example

Recording a distribution only takes a minute.

  1. Select the investment from your portfolio list.
  2. In the Transaction panel, click Add.
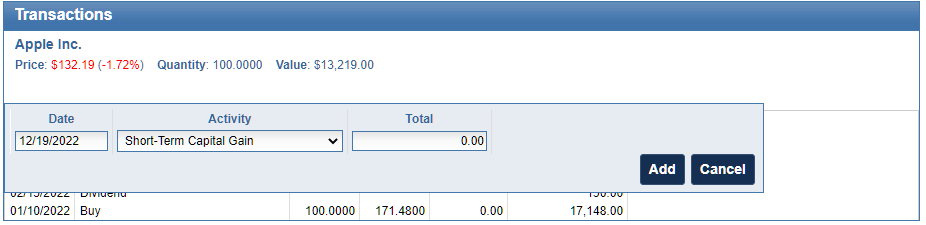
  3. Use the Activity dropdown to choose the type of distribution. For cash payments, select Dividend, Short Term Capital Gain, or Long Term Capital Gain. If the payout was used to buy more shares instead of being paid out as cash, select the Re Invested version of that same option.
  4. Enter the details of the distribution and click Add.

Once that is done, the transaction is reflected in your portfolio’s performance, cost basis, and income totals right away.

Example of entering a capital gain transaction in EquityStat
Example of entering a short-term capital gain.

How to View Your Total Dividend and Capital Gains Income

After you have recorded a few distributions, EquityStat gives you more than one way to see the full picture.

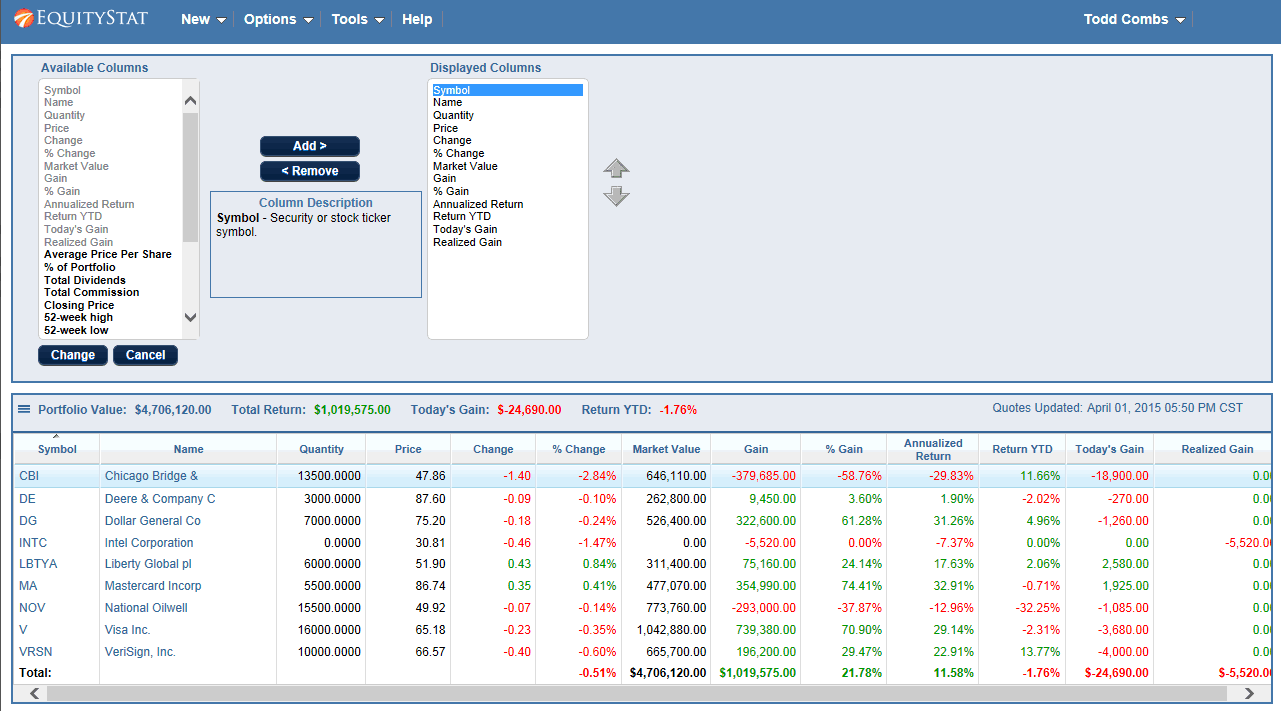
You can customize your portfolio columns by going to the Options menu and selecting Change Columns to add a Total Dividends column, which includes capital gains, directly to your main portfolio view. That way you can see income for each investment without digging through individual transactions.

You can also use the Analyze Portfolio page, found under the Tools menu, which provides graphical performance metrics for your entire account or for individual portfolios. It is a quick way to see income and returns over time without doing the math yourself.

Why This Matters Come Tax Time

When you track dividends and capital gains as they happen throughout the year, you are not stuck rebuilding twelve months of transactions in April. When it is time to file, EquityStat can also help you generate a capital gains report for IRS Form 8949, using the same transaction data you have already entered.

Frequently Asked Questions

Do I need to enter dividends manually in EquityStat? Yes. Dividends and capital gains distributions are entered through the Transaction panel for each investment, using the Activity dropdown to select the correct type of distribution.

What is the difference between short term and long term capital gains? Short term capital gains come from investments held for one year or less. Long term capital gains come from investments held for more than a year and are typically taxed at a lower rate.

Can I see total dividend income across my whole portfolio? Yes. Add the Total Dividends column to your portfolio view, or use the Analyze Portfolio tool for a graphical, account wide breakdown.

Does EquityStat help with tax reporting? Yes. EquityStat can generate a capital gains report formatted for IRS Form 8949 based on the transactions you have recorded.

2024 8949 IRS Tax Form Released

How to Generate Your Capital Gains and Losses Report

If you sold stocks or other investments in 2024, the IRS requires you to report your short‑term and long‑term capital gains and losses using IRS Form 8949. EquityStat now offers a fast, accurate way to generate this form automatically, perfect for tax filing season.

What is IRS Form 8949

IRS Form 8949 is used to report:

  • Short‑term capital gains/losses (assets held 1 year or less)
  • Long‑term capital gains/losses (assets held more than 1 year)

If you sold stocks, ETFs, mutual funds, crypto, or other investments in 2024, you must include this form with your tax return.

Generate the 2024 IRS Form 8949

EquityStat supports automatic creation of the 2023 Form 8949, making tax prep easier and more accurate.

How to Generate Form 8949 in EquityStat

  1. Open the Tools menu.
  2. Select Generate Form 8949.
  3. On the Form 8949 page, click Generate.
  4. EquityStat instantly calculates:
    • Short‑term gains/losses
    • Long‑term gains/losses
  5. A PDF version of IRS Form 8949 is created for download.

This PDF is formatted exactly as required by the IRS.

What You Can Do With the Generated Form 8949

  • Send it directly to your tax preparer
  • Upload it to your tax software
  • Print and include it with your paper tax return

Why Use EquityStat for Form 8949?

  • Accurate capital gains calculations
  • Automatic cost‑basis tracking
  • Fast PDF generation
  • Ideal for active traders and long‑term investors
  • Perfect for 2023 tax filing deadlines

Who Should Generate Form 8949?

You should generate this form if you:

  • Sold stocks in 2023
  • Sold ETFs or mutual funds
  • Sold crypto assets
  • Need a clean, IRS‑ready gains/losses report

If you had any investment sales in 2024, EquityStat’s Form 8949 generator saves time and reduces errors.

Example: IRS Form 8949 Output

Generate IRS Form 8949 to track your investment gains and losses for your taxes.
Form 8949 Example

Your generated PDF includes:

  • Short‑term transactions (Part I)
  • Long‑term transactions (Part II)
  • Totals for gains and losses
  • IRS‑compliant formatting

This ensures your tax filing is complete and accurate.

Start Your 2024 Form 8949 Now

If you sold investments in 2023 and need to calculate your gains or losses, use EquityStat’s Generate Form 8949 tool today.

Best and Worst Stocks of 2024

The stock market ended 2024 near record highs. The Nasdaq Composite rallied by 30%, while the S&P 500 climbed over 24%. The blue-chip Dow Jones rose a more modest 13%. The S&P 500 clinched 57 records, making it one of the top five years for most all-time highs recorded by the benchmark index.

Technology and Communications Services were the standout sectors, thanks to the artificial intelligence boom. Big Tech stocks, including Nvidia, Tesla, Alphabet, Amazon, Apple, Microsoft, and Meta, posted significant gains. Nvidia, in particular, rallied more than 175%

Here are the best performing stocks of 2024.

Best performing stocks of 2024

Here are the worst performing stocks of 2024.

Worst performing stocks of 2024

You can read more about the best and worst performing stocks here and here.

Note, if you want to share your portfolio in image format like you see above, go to here.

How to Import Your Yahoo Finance Portfolio Into EquityStat

If you are looking for an alternative to Yahoo Finance Portfolio, you can easily import your Yahoo Finance Portfolio into EquityStat.  Recently, we enhanced our import feature to work with Yahoo portfolios.

To import your Yahoo portfolio into EquityStat, just follow these easy steps.

Step #1
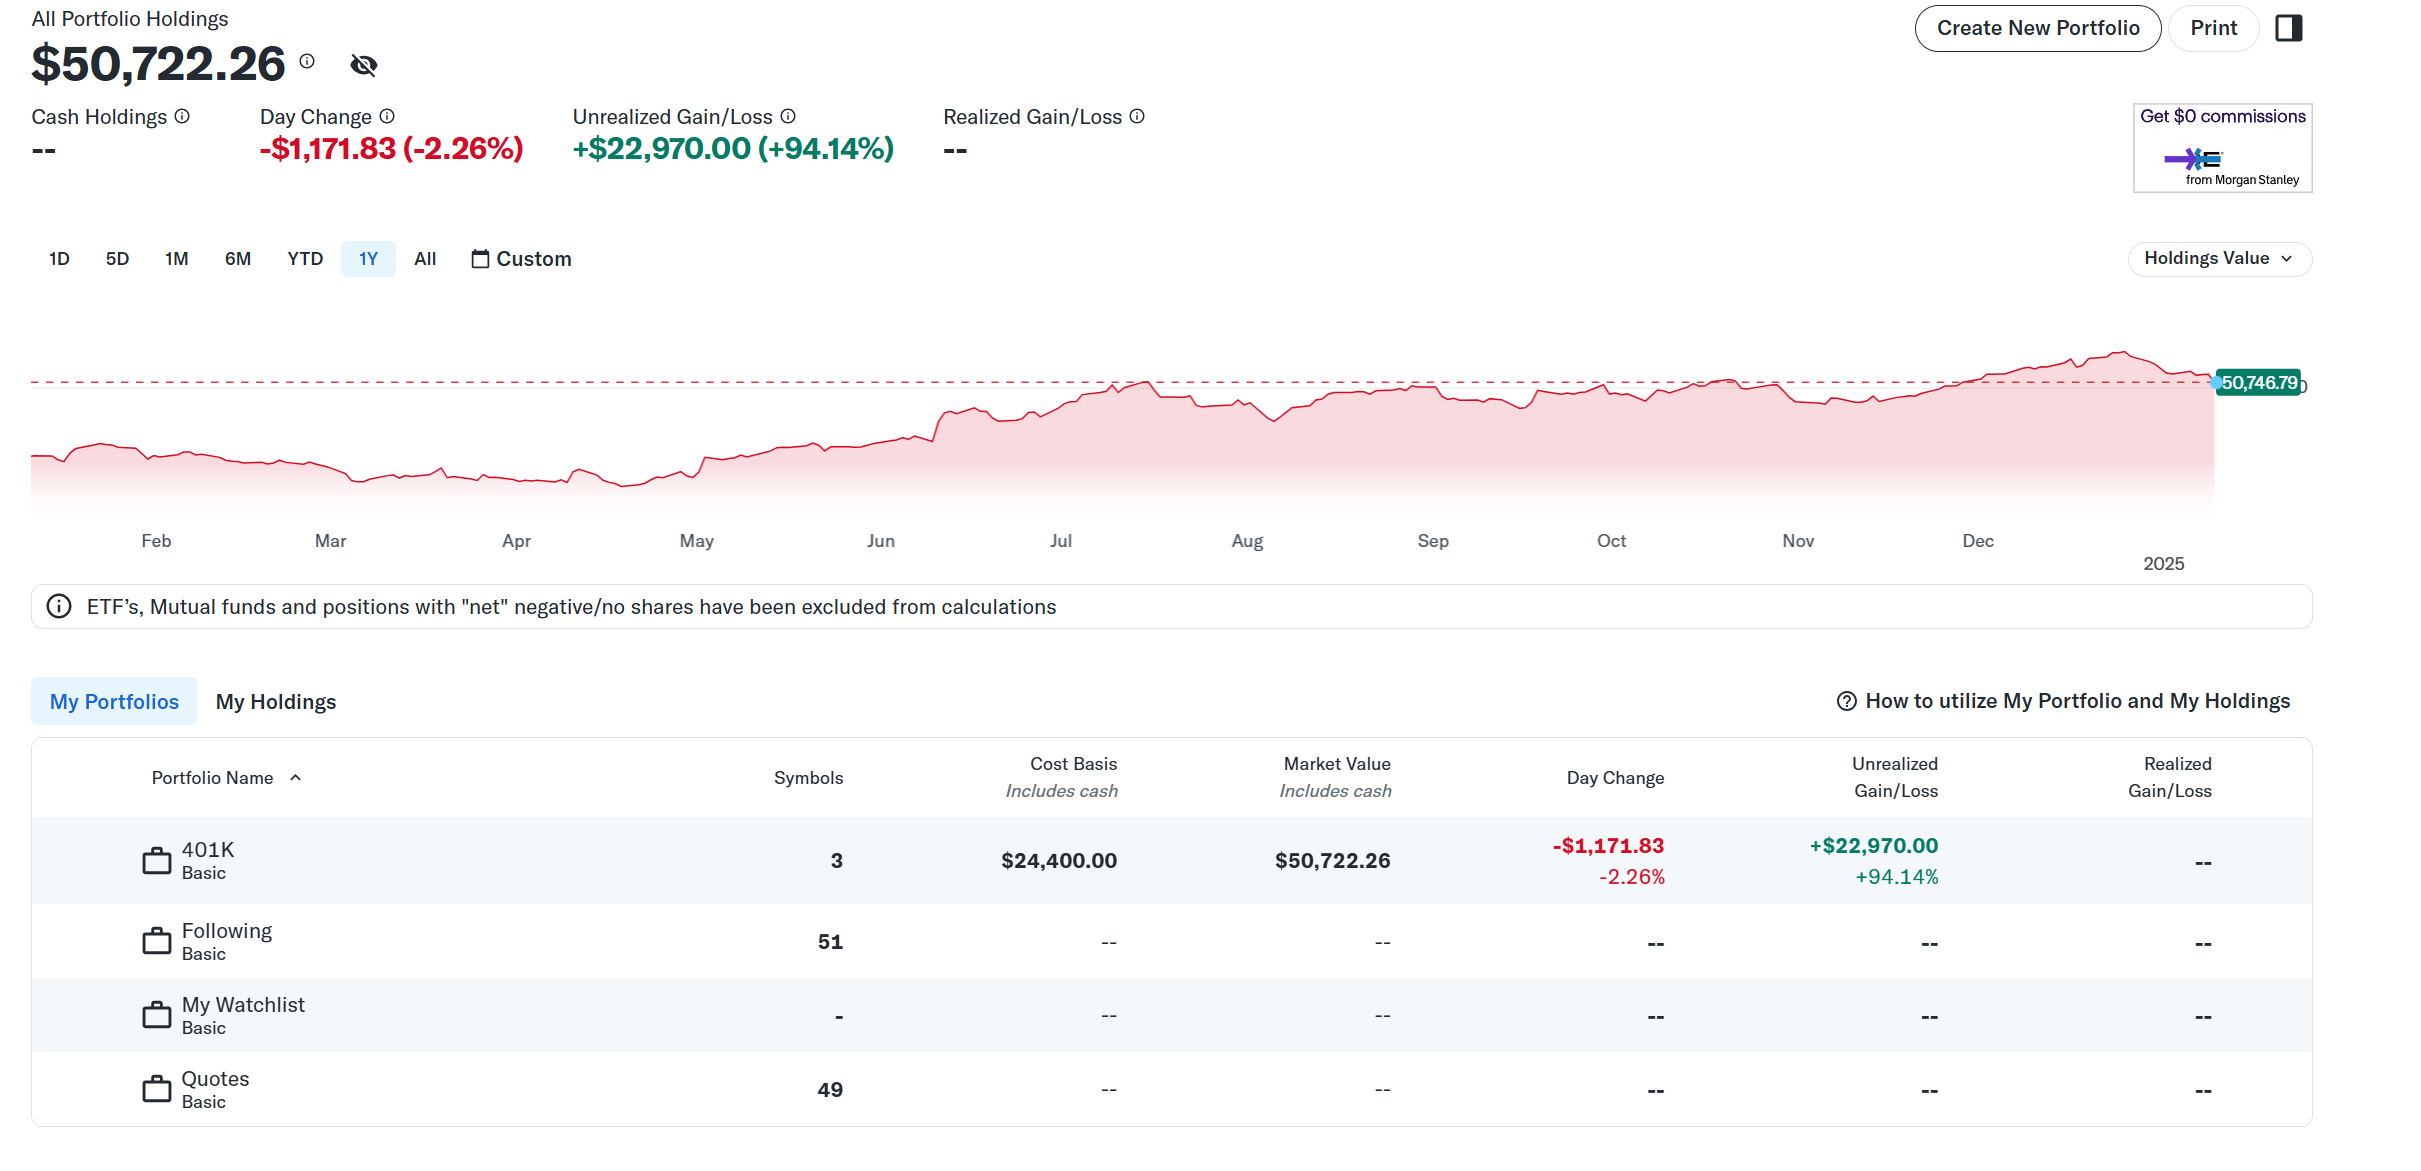
Login to your Yahoo Finance Portfolio and click on a portfolio with holdings.

Yahoo Finance Portfolio example

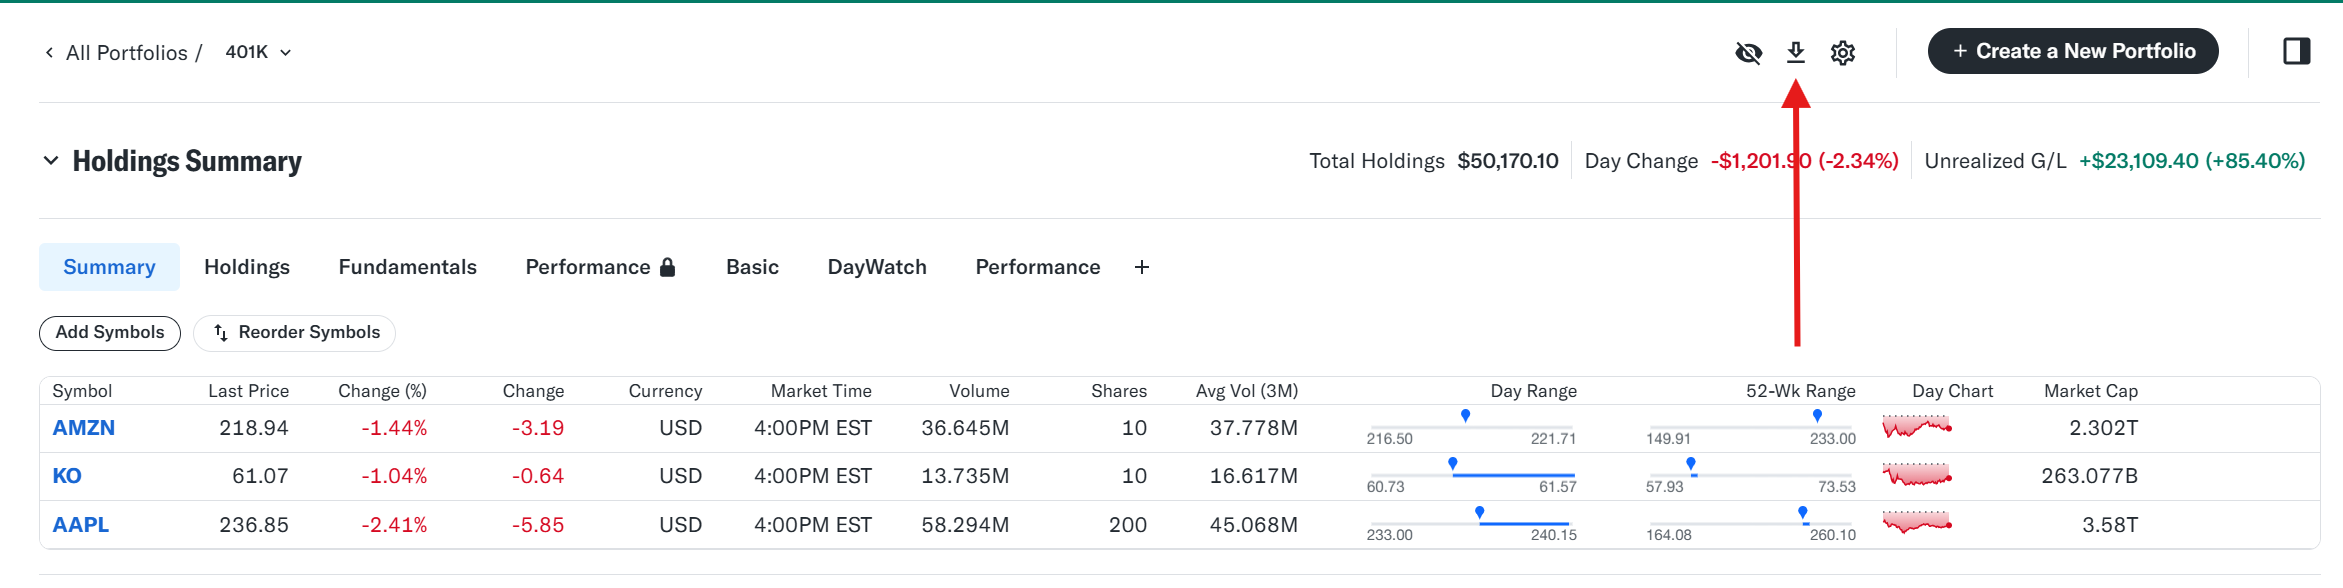
Step #2
On page that displays your holdings, click the down arrow icon in the upper right hand corner.

You will then be prompted to either Print the portfolio or Save the portfolio as a CSV. Choose the Save option. Your CSV file will then be saved to your Downloads folder on your computer.

Step #3
Login to your EquityStat account and click the New menu at the top and choose Import Transactions from the drop down menu. Choose the portfolio you want to import into. Next, choose the file you saved in Step #2.

If you have any questions, contact our support by clicking here.


Alphabet/Google Dividend

On June 17, 2024, Alphabet (GOOGL/GOOG) will pay a $0.20 dividend per share. This is the first dividend paid by Alphabet in the history of the company.

With EquityStat’s stock portfolio manager, it is easy to add and track your dividends.

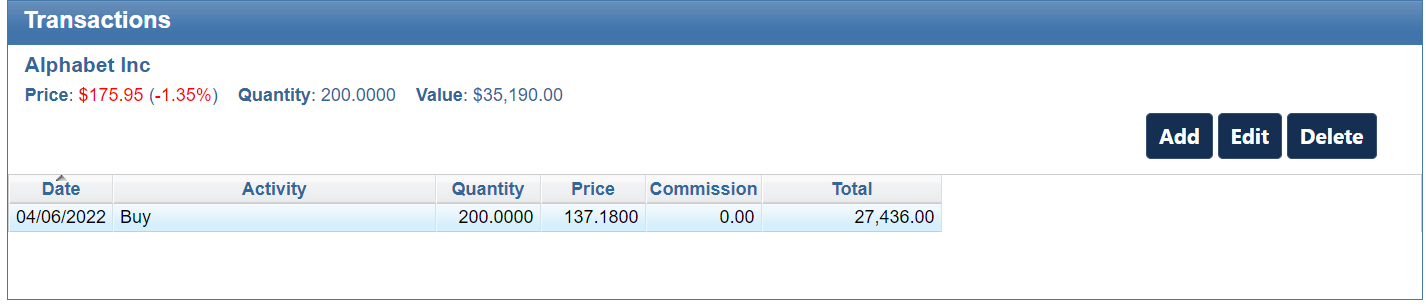
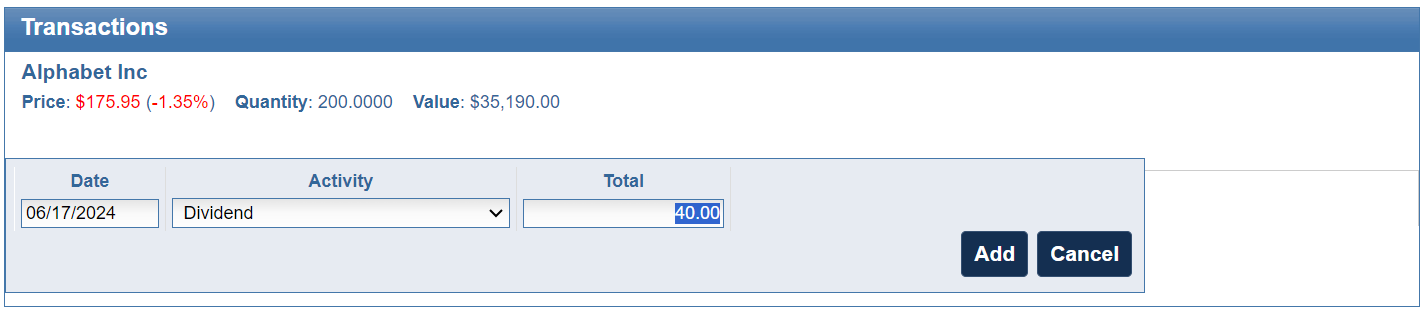
To add a dividend to your Alphabet investment, first select this investment in your investment panel. Then in the transactions panel, click the Add button to add a new transaction.

Add dividends to your EquityStat portfolio.
Alphabet dividend transactions example

Next, select either Dividend or Re-invested Dividend from the Activity drop down. If you didn’t re-invest the dividend, just enter the dividend amount in the Total field.

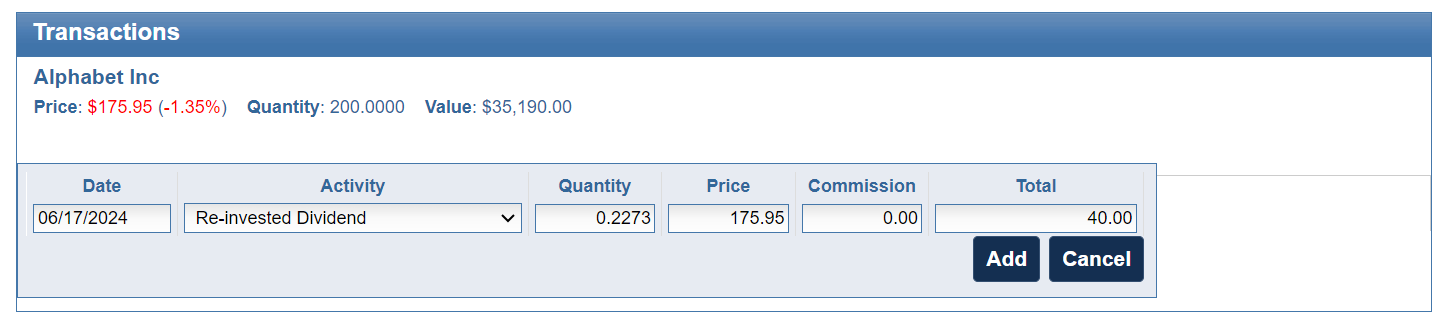
Add Alphabet dividend to your EquityStat portfolio.
Add Alphabet dividend transaction example

If you re-invested your Alphabet dividend, choose Re-invested Dividend from the Activity drop down. Enter the number of shares you purchased in the Quantity field and enter the price you paid for the shares.

Add a re-invested Alphabet dividend.
Add a Re-invested Dividend example

Once you have entered your dividend information, click the Add button to save the dividend transaction to your portfolio.

You can follow many of these same steps if you have a different investment that pays a dividend.

NVIDIA Stock Split in EquityStat

Nvidia’s (NVDA) stock is set to split on June 7th, 2024. It is a 10 for 1 stock split. So, for each share you own before the split, you get 10 shares.

If you owned Nvidia (NVDA) stock before the split and you are tracking this stock in your EquityStat portfolio, how do you record the split?

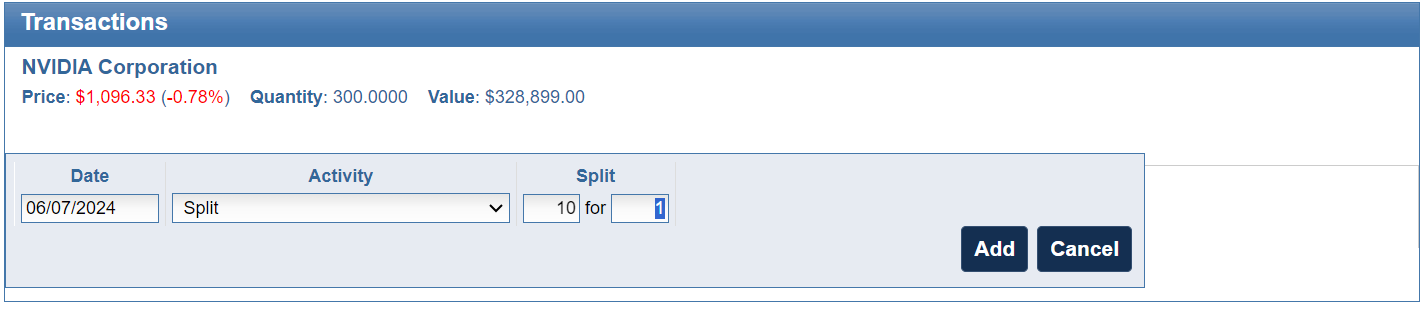
First, select the Nvidia stock in your investment panel. Next, in the transaction panel, click the Add button to add a new transaction. In the Activity drop down, choose a “Split” transaction. Enter how many shares were split, in this case it is a 10 for 1 split, and click the Add button to save the transaction.

EquityStat split Nvidia stock.
Nvidia stock split transaction

When the split transaction is saved, each transaction will be adjusted to reflect this split. The number of shares will be increased ten times and the price will be divided by ten.

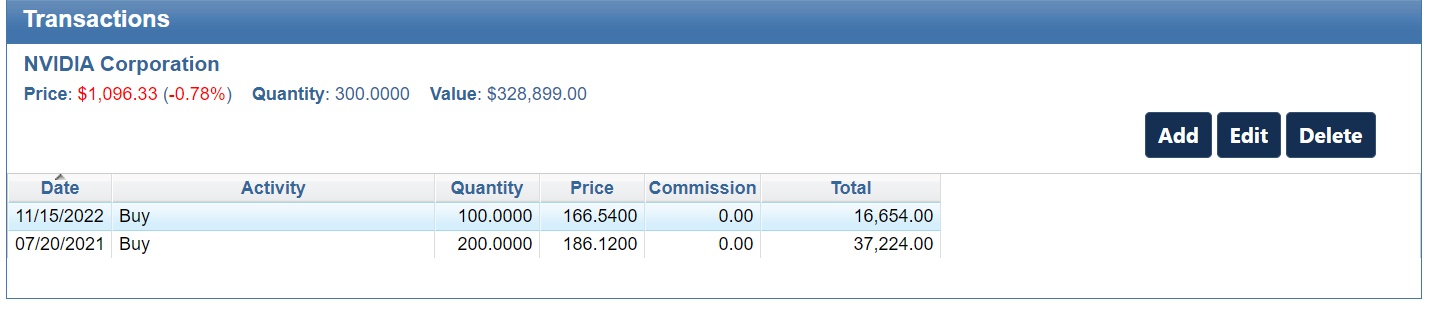
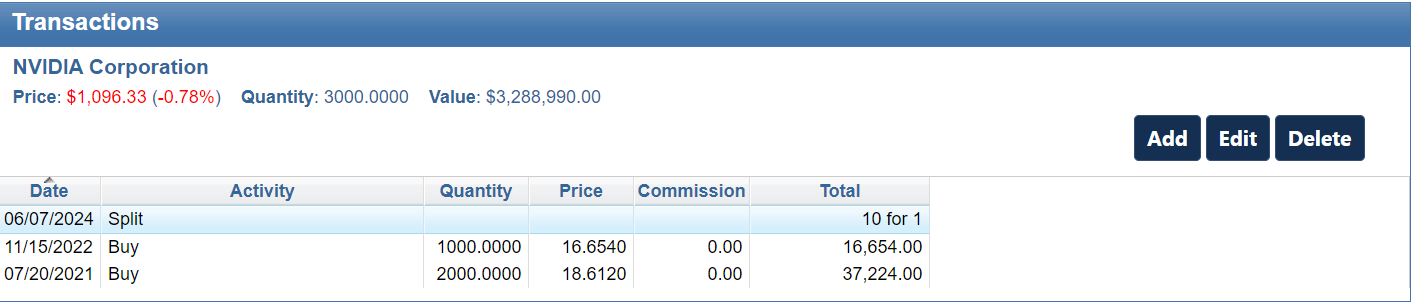
For example, if you had the following transactions before the split.

Nvidia transactions before the split in EquityStat stock portfolio tracker.
Nvidia transactions before the split.

After the split your transactions will look like this.

Nvidia transactions after the split in EquityStat stock portfolio tracker.
Nvidia after the split

Notice that before the split there were two buy transactions. After the split, the number of shares has increased 10 times and the price has been reduced by a factor of ten. For example, the initial buy on 07/21/2021 was for a quantity of 200 shares. After the split, the purchased quantity is 2000 shares. The price the shares were bought on 07/21/2021 was $186.12. After the split, the price paid was $18.61. These adjustments are all automatically done when you enter the split transaction.

If you have other stocks that have split, you can use the same steps to record your split. Just make sure that you enter the correct split information.

How to Add a New Investment to Your Portfolio From Your Phone

Adding a new stock, ETF, or mutual fund to your portfolio from your phone only takes a few seconds. It used to mean knowing the investment’s exact ticker symbol before you could type it into the mobile app. If you forgot whether a company traded under one symbol or a slightly different one, you were stuck looking it up somewhere else before you could even start. EquityStat’s mobile symbol search fixes that by letting you search by name or symbol right inside the app.

How Symbol Search Works on Mobile

Adding an investment now works the same way on your phone as it already does on desktop. When you are adding a new investment to your portfolio, start typing in the Symbol field. As you type, EquityStat shows you a list of matching symbols and investment names in real time.

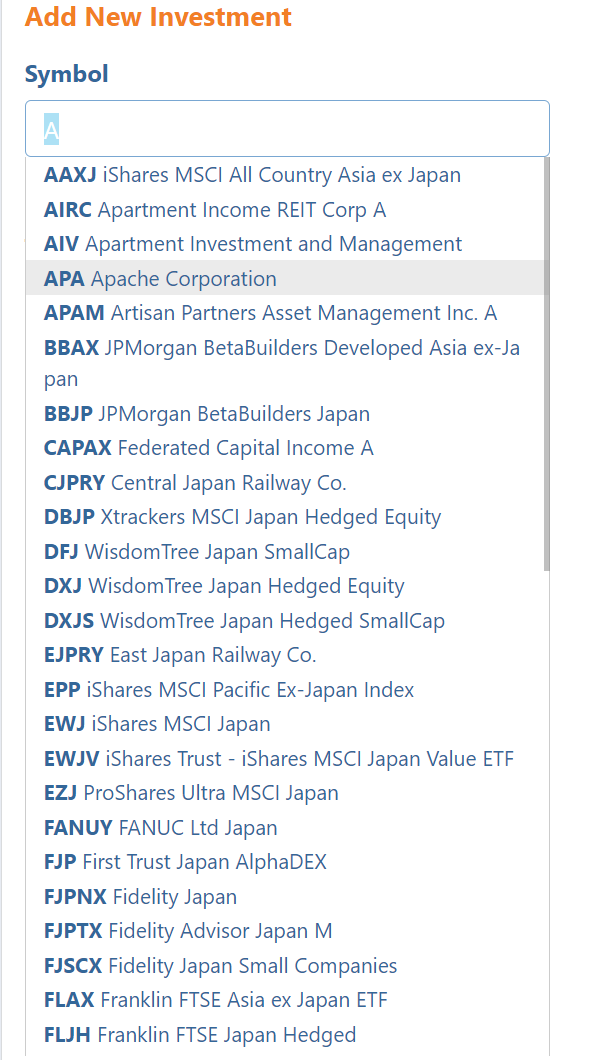
For example, type the letter A and you will see every symbol and investment name that matches, all narrowed down as you keep typing. Once you spot the investment you want, tap that line to select it, and the correct symbol is filled in automatically.

Lookup a symbol when adding a new investment to your EquityStat stock portfolio on a mobile device.
Example of the new symbol lookup when adding a new investment on a mobile device.

What If You Cannot Find Your Symbol

If your investment does not show up in the list, you can still type the symbol in directly and move to the next field. EquityStat will check whether it is a valid symbol. If it is not recognized, you will see an Invalid Symbol message so you know right away, rather than finding out later that your entry did not go through correctly. The Invalid Symbol message will display under the symbol in read. If it is a valid symbol, then the name of the investment will display under the symbol field in green.

Why This Makes Adding Investments Easier

Small friction points add up, and having to leave an app to look up a ticker symbol is exactly the kind of thing that makes portfolio tracking feel like a chore. With symbol search built directly into the mobile add investment screen, you can build out or update your portfolio from your phone just as easily as you can from a computer, whether you remember the exact symbol or just the company name.

Frequently Asked Questions

Do I need to know the exact ticker symbol to add an investment on mobile? No. You can start typing the company name or symbol in the Symbol field, and EquityStat will show you matching results as you type.

What happens if I type a symbol that is not found in the results? You can still type it in directly and move to the next field. EquityStat checks whether it is valid and shows an Invalid Symbol message if it is not recognized. If it is a valid symbol, then a Valid Symbol will be displayed.

Does adding an investment work the same way on mobile and desktop? Yes. The mobile symbol search was built to match the existing desktop experience, so the process feels the same on either device.

2023 8949 IRS Tax Form Released

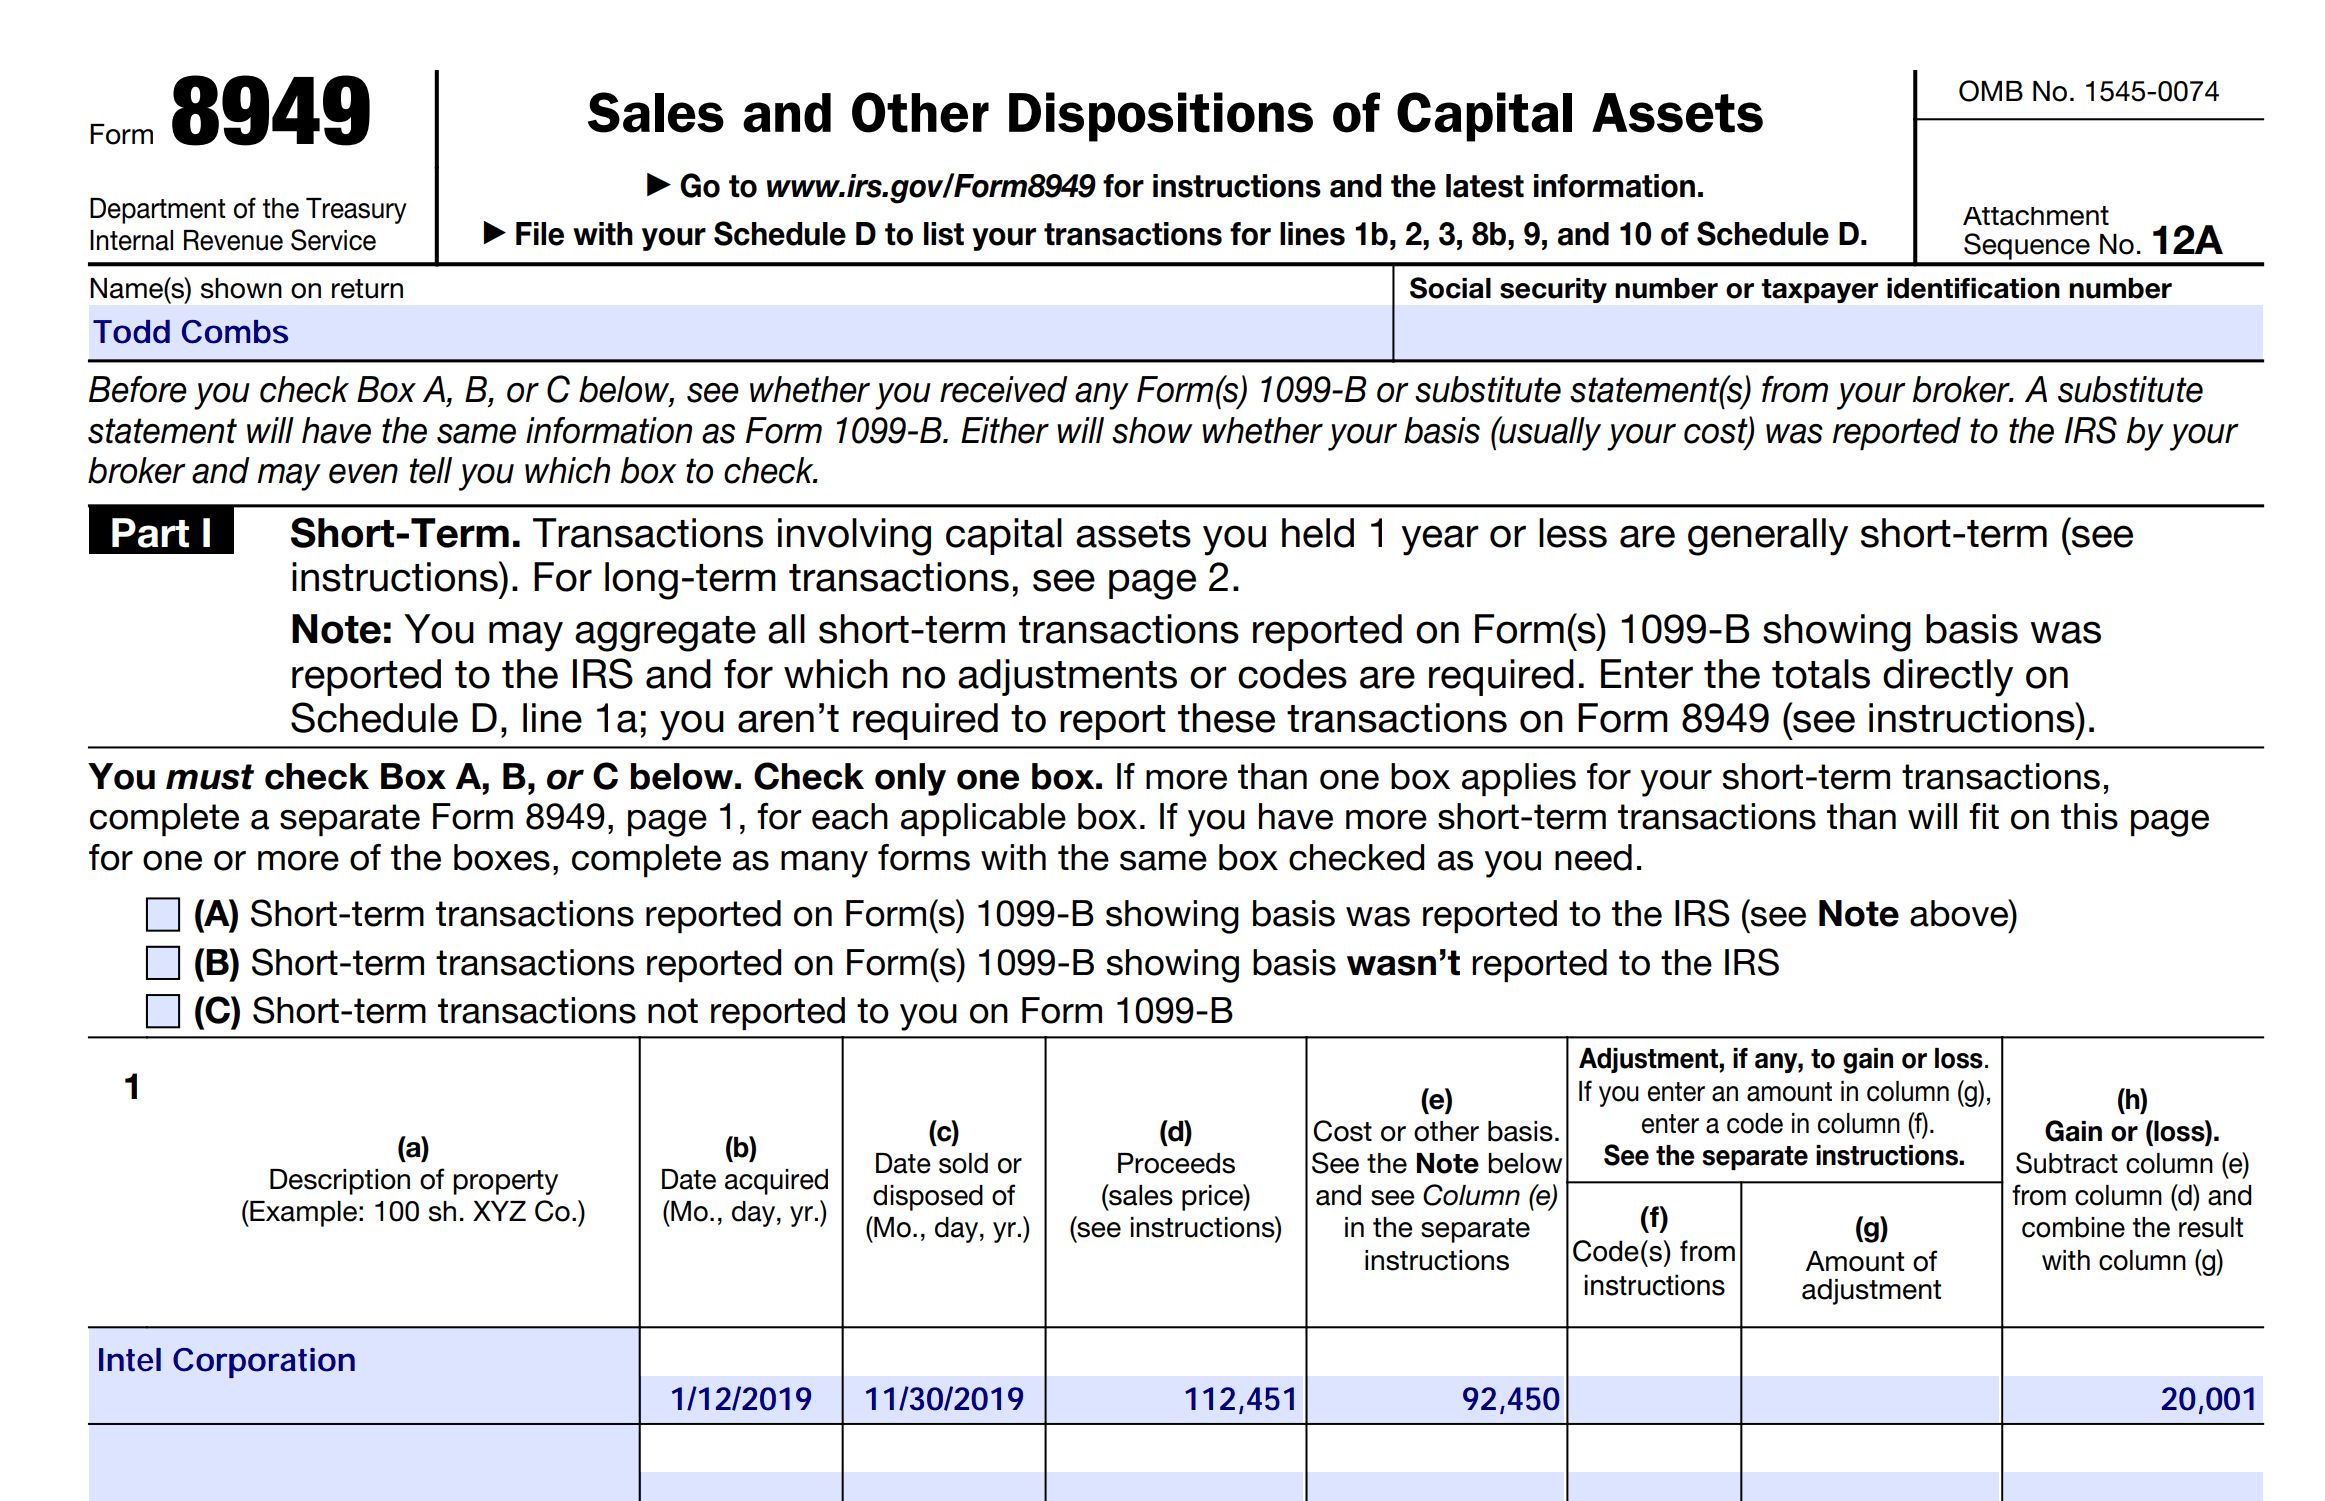
We just released the 2023 8949 IRS tax form.  IRS Form 8949 is a form that reports your short and long term gains/losses for any sold investments in the tax year.  If you had any investment sales in 2023, this form is a great way to easily calculate your losses/gains from this investment sale.

To generate Form 8949 click the Tools menu and choose the “Generate Form 8949” menuitem. On the “Generate Form 8949” page, click the Generate button. Your short-term and long-term gains/losses on any investment sales will then be calculated. Then a pdf format of IRS Form 8949 will be generated. This form has a short-term gains/losses section and long-term gains/losses section, which is what you need when filing your taxes.

Calculate your gains/losses on any stock sale with EquityStat and generate IRS Form 8949.
IRS Form 8949 Example

Once this pdf form is generated, you can then send this pdf file to your tax preparer or print a copy of it.

How to Share Your Stock Portfolio

Sharing your stock portfolio is now simple with EquityStat’s Share Portfolio feature. Whether you want to display what stocks you own on a personal website, show what you recommend on an investment forum, or post your holdings on X, Facebook, Reddit, or email, this feature makes it possible in just a few clicks.

How to Share Your Portfolio

To get started, click the Tools menu at the top of the page and choose Share Portfolio from the dropdown.

On the Share Portfolio page, choose the portfolio you want to share and click the Generate button. EquityStat will create an image of your portfolio that you can link to on a website or social media post. You can also download the image itself and use it in an email or upload it directly to a social media post.

For example, here is an image of a shared portfolio showing Berkshire Hathaway’s top stock holdings.

Linked Images vs Downloaded Images

There is an important difference between the two ways you can share your portfolio. If you link to the image, it will always display the most recent prices for the stocks in your portfolio, updating automatically over time. If you download the image file and share that instead, the prices shown will be frozen at whatever they were when the image was generated. Choosing between the two depends on whether you want a live, always current view or a fixed snapshot of your portfolio at a specific moment.

Customizing What Your Shared Portfolio Shows

You are not limited to a fixed set of columns when sharing your portfolio. Click the Select Columns link on the Share Portfolio page to choose exactly which columns appear in the image, whether that is current price, gain, return, or any other metric you want visible to whoever sees it.

Start Sharing Your Portfolio Today

Whether you are showing off your results, discussing a stock pick on a forum, or just want an easy way to keep friends and family updated on your investments, the Share Portfolio feature turns your EquityStat holdings into something you can post anywhere.

Stock Market Eye Alternative – Why EquityStat Is the Best Replacement

If you are searching for a Stock Market Eye alternative, here is what you need to know. Stock Market Eye’s stock portfolio manager has been discontinued, and anyone who relied on it for tracking their investments now needs a new home for their data.

What Happened to Stock Market Eye

Stock Market Eye was a popular tool for tracking stocks, but the software is no longer available or supported. Former users are left looking for a portfolio tracker that can pick up where it left off, both in terms of features and in terms of keeping their existing investment history intact.

Why EquityStat Is a Strong Stock Market Eye Alternative

EquityStat’s portfolio manager was built to track, manage, and analyze stocks, ETFs, mutual funds, and other investments in one place, which makes it a natural next step for anyone leaving Stock Market Eye behind.

How to Move Your Data from Stock Market Eye to EquityStat

Switching is straightforward. Export your existing data from Stock Market Eye to an Excel spreadsheet or a CSV file. Once the file is exported, follow the formatting instructions to prepare it, then upload it directly into EquityStat.

If you run into any trouble importing your transactions, reach out through the support page and the EquityStat team will help you get set up. You also have the option to enter your transactions manually if you prefer a fresh start instead of importing your history.

Missing a Feature from Stock Market Eye?

If there was a feature in Stock Market Eye’s portfolio manager that you relied on and do not see in EquityStat, let the team know. Feature requests are taken seriously, and the goal is to keep improving EquityStat based on what users actually need.

For any other questions, the support page is the fastest way to get answers.

Tech Times Recognizes EquityStat as the Best Investment Portfolio Management Software

In its annual review of financial technology tools, Tech Times named EquityStat the Best Investment Portfolio Management Software. This recognition highlights EquityStat’s growing influence in the fintech space and its commitment to helping investors make smarter, data‑driven decisions. As more individuals seek reliable tools to track and optimize their investments, EquityStat continues to stand out as a trusted platform for both new and experienced investors.

A Modern Solution for Today’s Investors
The investment landscape has changed dramatically over the past decade. With market volatility, rapid economic shifts, and an increasing number of retail investors entering the market, the need for accurate, real‑time portfolio tracking has never been greater. EquityStat addresses these challenges by offering a streamlined, intuitive platform that gives investors the insights they need to stay ahead.

Tech Times highlighted several reasons why EquityStat earned the top ranking:

Clean, user‑friendly interface Whether you’re a beginner or a seasoned investor, EquityStat makes portfolio management simple and accessible.

Real‑time market and portfolio data Investors can monitor performance instantly, allowing them to react quickly to market changes.

Advanced performance analytics EquityStat provides detailed metrics, trend analysis, and historical comparisons that help users understand how their investments are performing over time.

Personalized portfolio insights The platform adapts to each user’s investment style, risk tolerance, and long‑term goals.

Designed for Investors at Every Level

One of the reasons EquityStat has gained such a strong following is its ability to serve a wide range of investors. Beginners appreciate the platform’s simplicity and educational value, while experienced investors rely on its precision and analytical depth.

EquityStat is especially valuable for:

  • Long‑term investors tracking retirement portfolios
  • Active traders monitoring daily performance
  • Tech‑sector investors who need fast, accurate data
  • Individuals managing multiple brokerage accounts
  • Anyone seeking a clearer picture of their financial progress

By consolidating data and providing actionable insights, EquityStat helps users make informed decisions that support long‑term financial growth.

Why Tech Times’ Recognition Matters

Tech Times is known for its in‑depth reviews of technology products and software solutions. Its annual rankings influence consumer decisions and highlight the tools that deliver real value. Being named the best investment portfolio management software places EquityStat among the most trusted and innovative platforms in the fintech industry.

This recognition also reinforces EquityStat’s mission: to empower everyday investors with the same level of insight and clarity that professional analysts rely on.

You can read the entire article here.

https://www.techtimes.com/articles/294138/20230724/top-5-best-investment-portfolio-management-software-2023.htm

Automatic Stock Price Lookup: A New Way to Log Trades Faster in EquityStat

EquityStat’s stock portfolio tracker now fills in the price of a stock automatically whenever you add a new investment or log a transaction, so you no longer have to look up the exact price of a stock on a specific day by hand.

How Automatic Stock Price Entry Works

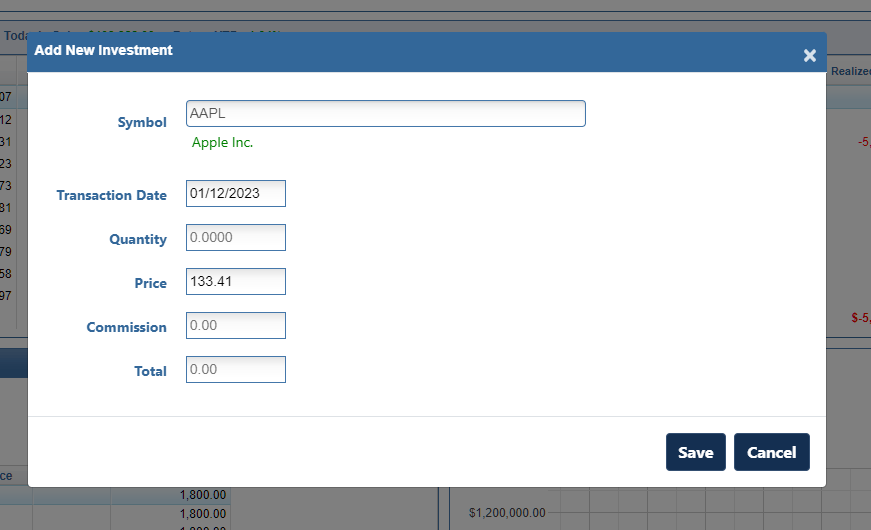
When you enter a new stock, ETF, or add a transaction to an investment you already track, EquityStat pulls the closing price, or the current price if the market is still open, for that exact date and places it in the Price field for you. You do not have to search another site or dig through old statements to find the number.

If the price shown is not the one you actually paid or received, you can simply type over it. The automatic price is a starting point, not a requirement.

Example of the auto price feature in EquityStat's portfolio tracker
Example of the auto price feature in EquityStat’s portfolio tracker

Why This Feature Matters for Investors

Many investors do not remember the exact price they paid for a stock, months or years earlier. This feature was built for that exact situation. If you know you bought Apple stock on January 12, 2023 but cannot recall the price, EquityStat fills in the closing price from that date, $134.56, without any extra effort on your part. If your actual purchase price was different, you can adjust it in seconds.

This makes it much easier to keep an accurate, up to date portfolio tracker, even when you are recording trades after the fact or catching up on transactions from earlier in the year.

Look Up Historical Stock Prices in Seconds

The same feature also works as a quick way to check what a stock was trading for on any past date. Select the stock, enter the date, and the price appears immediately. This is useful for confirming cost basis, checking historical performance, or simply satisfying curiosity about how a stock has moved over time.

Start Tracking Your Portfolio More Efficiently

Automatic price entry is one more way EquityStat helps investors manage their stocks, ETFs, mutual funds, and other holdings without unnecessary manual work. If you have not tried EquityStat’s portfolio tracker yet, see how it works and start tracking your investments with less effort and more accuracy.

2022 8949 IRS Tax Form Released

We just released the 2022 8949 IRS tax form.  IRS Form 8949 is a form that reports your short and long term gains/losses for any sold investments in the tax year.  If you had any investment sales in 2022, this form is a great way to easily calculate your losses/gains from this investment sale.

To generate Form 8949 click the Tools menu and choose the “Generate Form 8949” menuitem. On the “Generate Form 8949” page, click the Generate button. Your short-term and long-term gains/losses on any investment sales will then be calculated. Then a pdf format of IRS Form 8949 will be generated. This form has a short-term gains/losses section and long-term gains/losses section, which is what you need when filing your taxes.

Calculate your gains/losses on any stock sale with EquityStat and generate IRS Form 8949.
IRS Form 8949 Example

Once this pdf form is generated, you can then send this pdf file to your tax preparer or print a copy of it.

Investment Symbol Search – A Faster Way to Add Stocks in EquityStat

EquityStat’s investment symbol search makes adding a new stock, ETF, or mutual fund to your portfolio faster and easier than ever. In the past, adding an investment meant you needed to already know its exact ticker symbol. Now, you can simply start typing in the Symbol field and EquityStat will display a list of matching symbols and investment names as you type.

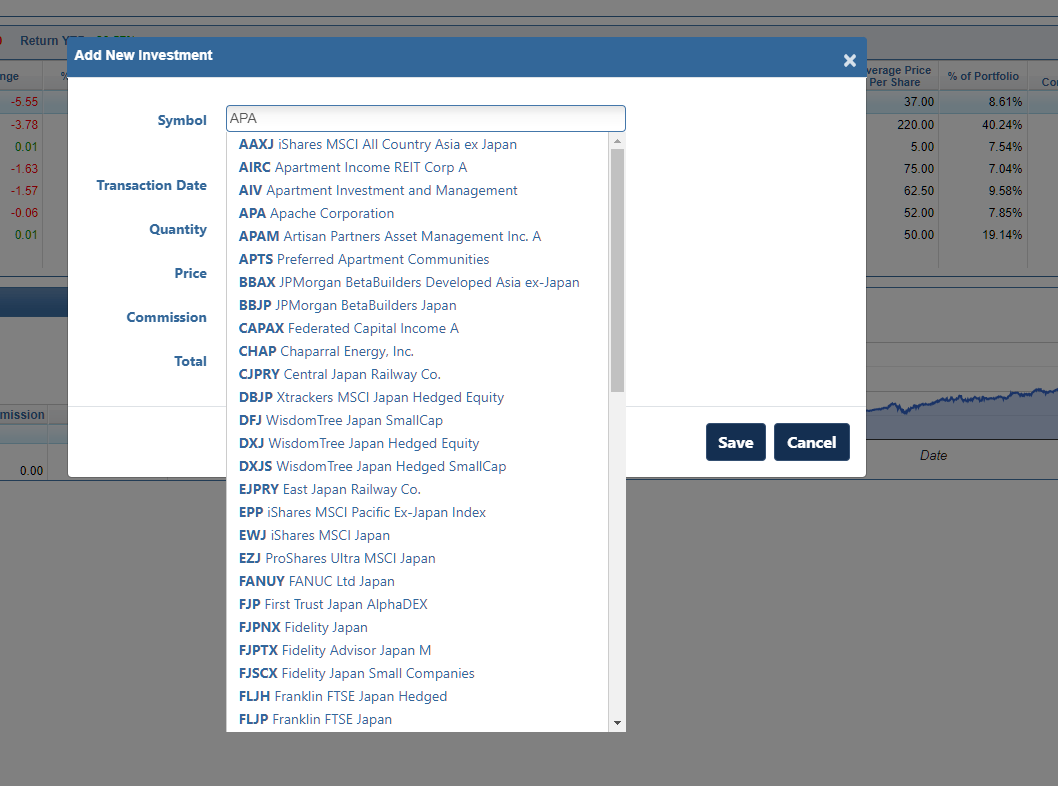
Lookup a symbol when adding a new investment to your EquityStat stock portfolio.
Example of the new symbol lookup when adding a new investment

How Investment Symbol Search Works

When you click New from the menu and choose New Investment, the Symbol field is now searchable. For example, as seen in the screenshot above, typing “APA” in the symbol field brings up a list of every symbol and investment name that matches that text. Instead of guessing at a ticker or leaving the site to look one up, you can scan the list and find the exact investment you are looking for in a few keystrokes.

To choose a symbol, simply select the line with the investment you want to add to your portfolio, and EquityStat fills in the rest.

What to Do If Your Symbol Is Not Listed

If you already know the symbol and it does not appear in the search results, you can still type it in directly and tab to the next field. EquityStat will check the symbol to confirm it is valid. If the symbol does not match a real investment, you will see an “Invalid Symbol” message so you know to double check it before continuing.

Why This Makes Tracking Your Portfolio Easier

Small friction points, like having to look up a ticker symbol before you can even add an investment, add up over time, especially if you are entering several positions at once. Investment symbol search removes that extra step, so building out your portfolio in EquityStat is quicker whether you are setting up your account for the first time or adding a new position you just purchased.

This feature also works the same way on mobile, so you get a consistent experience whether you are updating your portfolio from a desktop or adding a quick transaction from your phone.

EquityStat: The Best Alternative to Morningstar’s Legacy Portfolio Manager

Looking for an Alternative for Morningstar’s Legacy Portfolio Manager?

Morningstar has discontinued its legacy portfolio tracker, leaving many investors searching for a reliable, easy‑to‑use alternative. EquityStat is a powerful, intuitive stock portfolio tracker built by investors for investors and it’s one of the best replacements available today.

Why EquityStat Is the Ideal Morningstar Legacy Portfolio Alternative

EquityStat offers a clean, simple interface and robust performance tracking tools designed for everyday investors and active traders.

Key Benefits

  • Aggregate all your investment accounts in one place
  • Track your dividends and capital gains
  • View account and portfolio value and gain/loss
  • Analyze individual stocks, ETFs, and mutual funds
  • See today’s gain/loss, annualized return, realized gains, and return ytd
  • Review every transaction for each investment
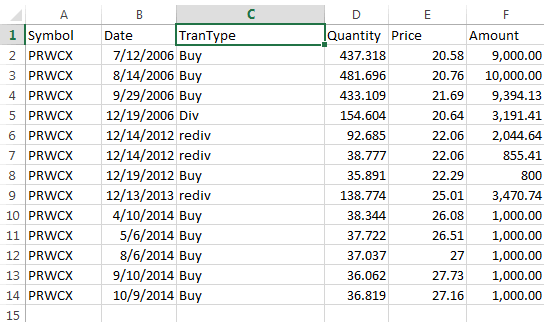
  • Import transactions manually or via spreadsheet
  • Create multiple portfolios for better organization
  • View performance graphs and compare to stock market indexes
  • View your portfolio on a previous date

What You Can Track With EquityStat

EquityStat provides detailed analytics for each investment, including:

  • Daily gain/loss
  • Annualized return
  • Return YTD
  • Realized gains
  • Transaction history
  • Portfolio‑level and account‑level value and performance

Portfolio Analysis Tools

EquityStat includes a powerful Portfolio Analysis page that helps you:

  • Compare performance across multiple portfolios
  • Identify top‑ and bottom‑performing investments
  • View performance charts over time and compare to stock indexes
  • Analyze holdings and allocation

This is especially useful for investors managing multiple accounts or diversified portfolios.

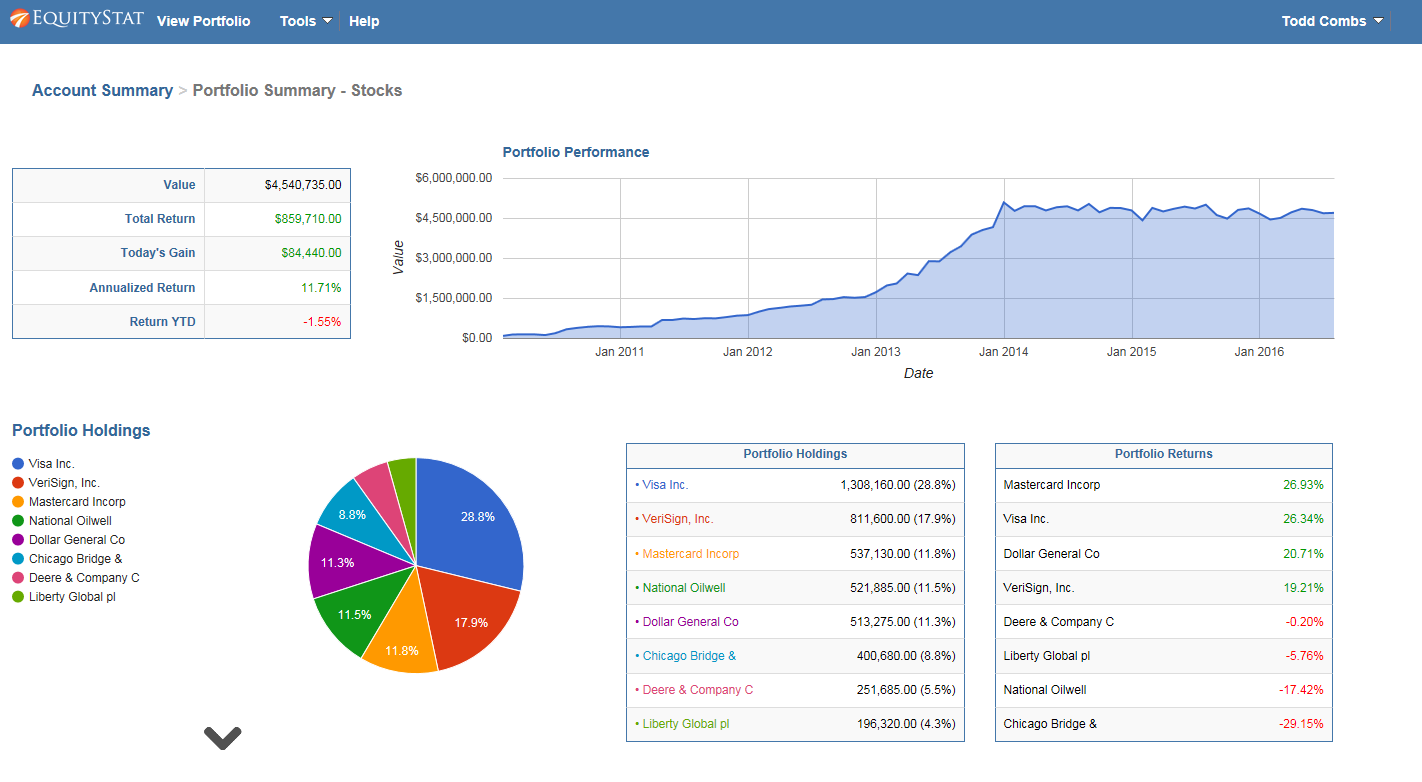
Analyze your stock portfolio
Example of EquityStat’s Portfolio Analyze Page

Importing Your Morningstar Legacy Portfolio

If you previously used Morningstar’s legacy portfolio manager, EquityStat makes it simple to transition.

You’ll be up and running quickly with your full investment history intact.

Why Investors Choose EquityStat

  • Built by investors, for investors
  • Simple, intuitive interface
  • Accurate performance calculations
  • Fast, reliable, and easy to use
  • Ideal for stock, ETF, and mutual fund tracking
  • A strong alternative to Morningstar’s Legacy Portfolio manager discontinued tool

If you’re disappointed to see Morningstar’s legacy portfolio manager go, EquityStat is the perfect replacement.

If you need help importing your Morningstar Legacy portfolio manager into EquityStat, contact our support staff here.

How to Record a Stock Split in EquityStat – Tesla (TSLA)

Stock splits change the number of shares you hold and the price you paid for them, without changing the actual value of your investment. If you don’t record a split correctly in your stock portfolio tracker, your share count and cost basis will be wrong going forward, which throws off both your performance numbers and your eventual capital gains calculations. This guide walks through exactly how to record a split in EquityStat, using Tesla’s (TSLA) August 2022 3-for-1 split as a real example.

Why Recording a Split Correctly Matters

When a stock splits, your share count and price per share both change, but your total position value stays the same. Most splits, like Tesla’s, increase your share count and lower the price per share. A reverse split works the other way, decreasing your share count and raising the price per share. Tesla’s split was a 3-for-1 split, meaning for every share you owned before the split, you owned three afterward. If a split isn’t recorded, your portfolio will show the wrong share count and an inflated cost basis per share, both of which affect your reported gains or losses when you eventually sell.

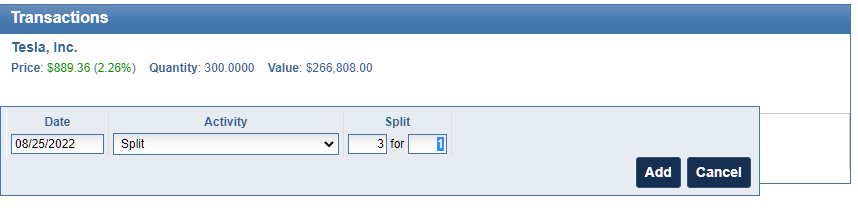
How to Record a Split in EquityStat

  1. Select the stock in your investment panel.
  2. In the transaction panel, click Add to create a new transaction.
  3. In the Activity dropdown, choose Split.
  4. Enter the split ratio. For Tesla’s split, that’s 3 for 1.
  5. Click Add to save the transaction.
EquityStat Stock Portfolio tracker transaction split Tesla stock
Tesla Split Transaction

Once the split transaction is saved, EquityStat automatically adjusts every prior transaction for that stock to reflect the split. Share counts are multiplied and the price paid per share is divided accordingly, so your cost basis stays accurate without any manual recalculation.

A Real Example: Tesla’s 3-for-1 Split

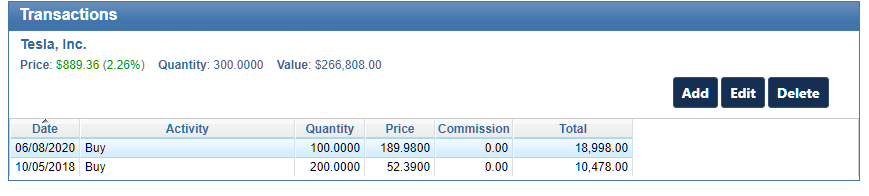
Here’s what a set of Tesla transactions looked like before the split was recorded.

Tesla transactions before the split in EquityStat stock portfolio tracker.
Tesla transactions before the split.

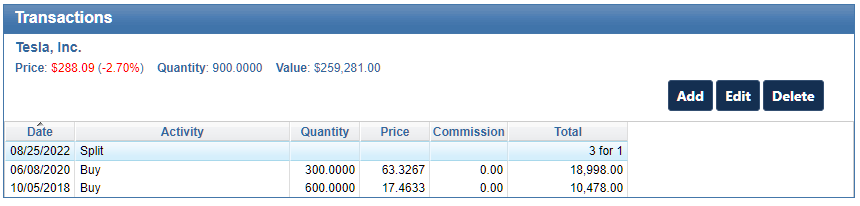
And here’s the same set of transactions immediately after entering the split.

Tesla transactions after the split in EquityStat stock portfolio tracker.
Tesla transactions after the split

Notice the initial buy on 10/25/2018 was originally for 200 shares at $52.39 per share. After the split, that same transaction shows 600 shares at $17.46 per share, three times the shares at one-third the price. The total dollar value of the position is unchanged; only the share count and per-share price are adjusted.

Recording Splits for Other Stocks

These same steps work for any stock split, not just Tesla’s. Whenever a company you hold announces a split, select the correct stock, add a Split transaction, and enter that company’s specific split ratio (2-for-1, 3-for-1, 4-for-1, or any other ratio). EquityStat handles the share and price adjustments automatically once the ratio is entered correctly.

Frequently Asked Questions

Do I need to update my cost basis manually after a stock split? No. Once you enter the split transaction with the correct ratio, EquityStat automatically recalculates the share count and price paid for every prior transaction on that stock.

What split ratio was Tesla’s 2022 stock split? Tesla’s August 2022 split was a 3-for-1 split, meaning shareholders received two additional shares for every share they owned.

Does a stock split affect my capital gains taxes? No. A stock split changes your share count and cost basis per share, but not the total value of your position or your actual gain or loss when you eventually sell.

Mutual Fund Investments Now Show the Last Update Date

Mutual fund prices now show the exact date they were last updated, right in your transaction panel. We added a date stamp directly next to the price, so it is easy to tell how current the price is.

Why Mutual Funds Only Update Once a Day

Unlike stocks and ETFs, mutual funds do not trade throughout the day. Their price, known as the net asset value, is calculated once the market closes and is not posted until sometime after that. Because of this timing, it has always been hard to tell whether the price you are looking at reflects the current day or the day before, especially if you check your portfolio in the morning before the new price has come through. Now, next to every mutual fund price, you will see the exact date that price was posted. One glance tells you whether you are looking at a fresh number or one that is a day old.

EquityStat Mutual Fund Price Date

More Transaction Panel Changes

Percent Change Now Shown In the Transaction Panel

Another user interface change to the transaction panel is that we are now showing the percent change in the transaction panel for every investment, alongside the dollar figure.

Quick Access to Financial Details from the Transaction Panel

We also made it easier to see financial detail on any holding without leaving your portfolio. Click the name of any investment in the transaction panel and you will be taken straight to its page on MSN Money, where you can dig into news, charts, and additional details.

A Faster, Clearer Portfolio Review

Together, these changes are meant to make your daily portfolio review faster and clearer. You should never have to wonder if a number is stale or squint to figure out which holdings moved. With the updated date stamps and color coded percent changes, that information is right there in front of you.

If you track mutual funds, stocks, ETFs, or a mix of everything, log in and take a look at your transaction panel to see the changes for yourself.

Google Stock Split in EquityStat

Google’s (GOOG/GOOGL) stock is scheduled to split on July 15, 2022. It is a 20 for 1 stock split. So, for each share you own before the split, you get 20 shares.

If you owned Google (GOOG/GOOGL) stock before the split and you are tracking this stock in your EquityStat portfolio, how do you record the split?

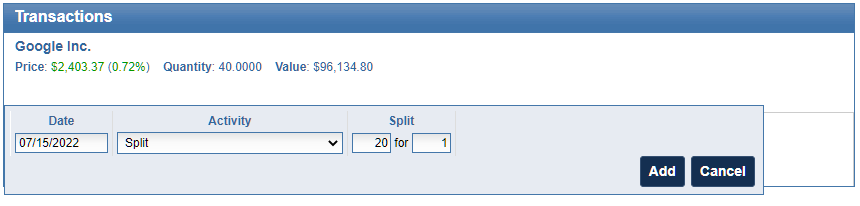
First, select the Google stock in your investment panel. Next, in the transaction panel, click the Add button to add a new transaction. In the Activity drop down, choose a “Split” transaction. Enter how many shares were split, in this case it is a 20 for 1 split, and click the Add button to save the transaction.

Add a split transaction in EquityStat's investment portfolio tracker.
Adding a split transaction in your EquityStat stock portfolio tracker

When the split transaction is saved, each transaction will be adjusted to reflect this split. The number of shares will be increased twenty times and the price will be divided by twenty.

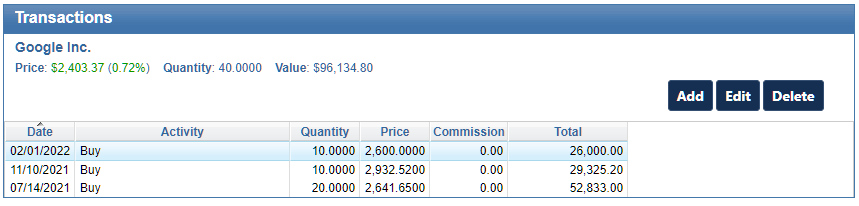
For example, if you had the following transactions before the split.

EquityStat transactions for Google (GOOG) before the 20 for 1 split
Google transactions before the split

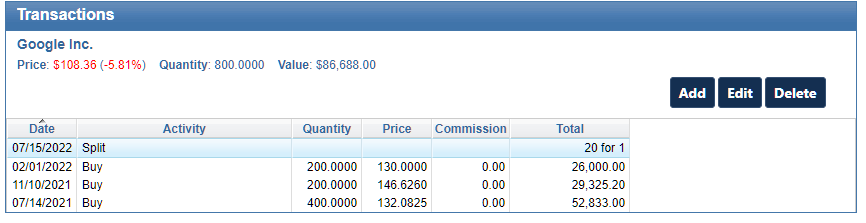
After the split your transactions will look like this.

EquityStat transactions for Google (GOOG) after the 20 for 1 split
Google transactions after the split

Notice that before the split there were three buy transactions. After the split, the number of shares has increased 20 times and the price has been reduced by a factor of twenty. For example, the initial buy on 7/14/2021 was for a quantity of 20 shares. After the split, the purchased quantity is 400 shares. The price the shares were bought on 7/14/2021 was $2641.65. After the split, the price paid was $132.08. These adjustments are all automatically done when you enter the split transaction.

If you have other stocks that have split, you can use the same steps to record your split. Just make sure that you enter the correct split information.

Refresh User Interface For Mobile Phones

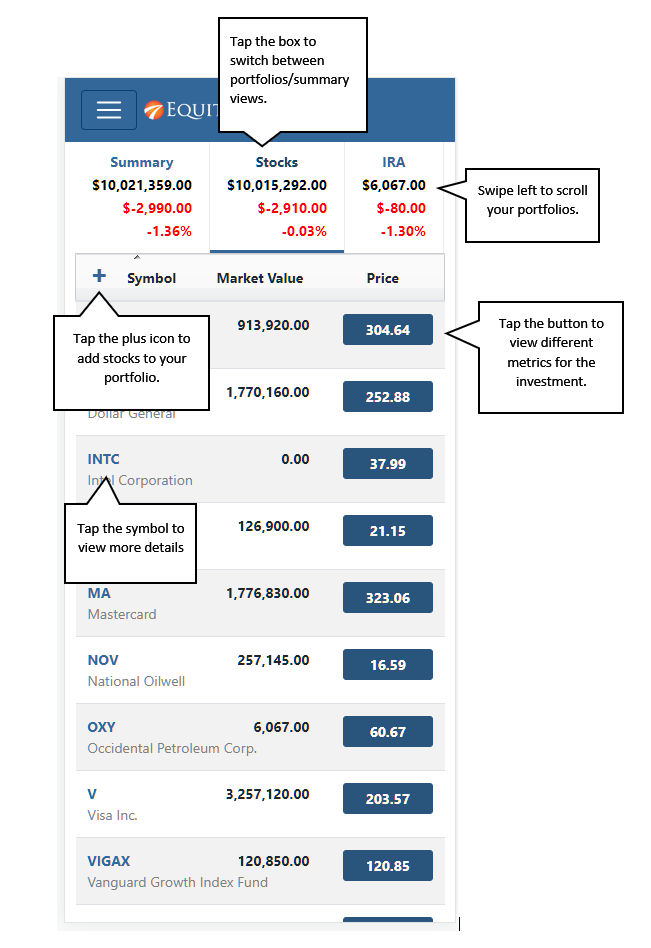
We have recently refreshed the user interface of your EquityStat portfolio on mobile devices. The user interface now looks, feels and works like a mobile app. If you have ever used the Weather Channel App or the ESPN App on your mobile phone, EquityStat works very similar.

To view your EquityStat account on a mobile phone, open up the phone’s web browser, go to www.equitystat.com and login to your account.

EquityStat stock portfolio tracker on a mobile phone.
Example EquityStat Account on a Mobile Phone.

You will then see a list of all your portfolios at the top. You can swipe left at the top to scroll through all of your portfolios. Tap a “portfolio box” to see the investments in each portfolio.

To see details about a specific investment, tap the symbol for the investment. To view metrics about a specific investment tap the price button. Continue tapping the button to cycle through all of the investment metrics.

To add a new investment to your portfolio, tap the plus icon.

Splitting a Stock in EquityStat

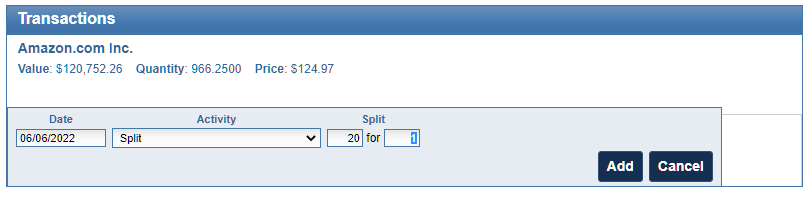
Amazon’s (AMZN) stock recently split. It was a 20 for 1 stock split. So, for each share you owned before the split, you got 20 shares.

If you owned Amazon (AMZN) stock before the split and you are tracking this stock in your EquityStat portfolio, how do you record the split?

First, select the Amazon stock in your investment panel. Next, in the transaction panel, click the Add button to add a new transaction. In the Activity drop down, choose a “Split” transaction. Enter how many shares were split, in this case it is a 20 for 1 split, and click the Add button to save the transaction.

Add a split transaction in EquityStat's investment portfolio tracker.
Adding a split transaction in your EquityStat portfolio

When the split transaction is saved, each transaction will be adjusted to reflect this split. The number of shares will be increased twenty times and the price will be divided by twenty.

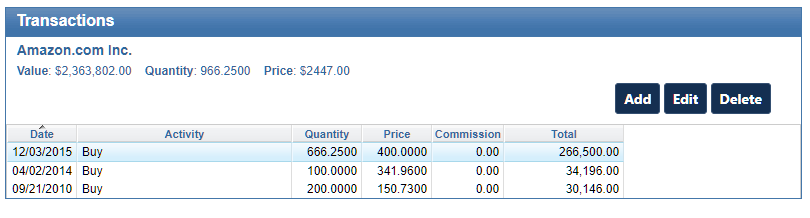
For example, if you had the following transactions before the split.

EquityStat transactions for Amazon (AMZN) before the 20 for 1 split
Amazon transactions before the split

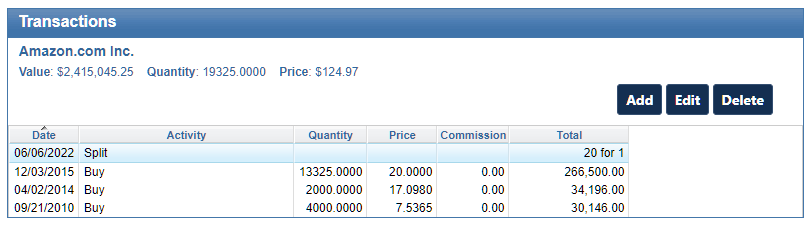
After the split your transactions will look like this.

EquityStat transactions for Amazon (AMZN) after the 20 for 1 split
Amazon transactions after the split

Notice that before the split there were three buy transactions. After the split, the number of shares has increased 20 times and the price has been reduced by a factor of twenty. For example, the initial buy on 4/02/2014 was for a quantity of 100 shares. After the split, the purchased quantity is 2000 shares. The price the shares were bought on 4/02/2014 was $341.96. After the split, the price paid was $17.098. These adjustments are all automatically done when you enter the split transaction.

If you have other stocks that have split, you can use the same steps to record your split. Just make sure that you enter the correct split information.

Feature Highlight – Compare Your Investment Performance to the Dow Jones, the Nasdaq or the S&P 500 Index

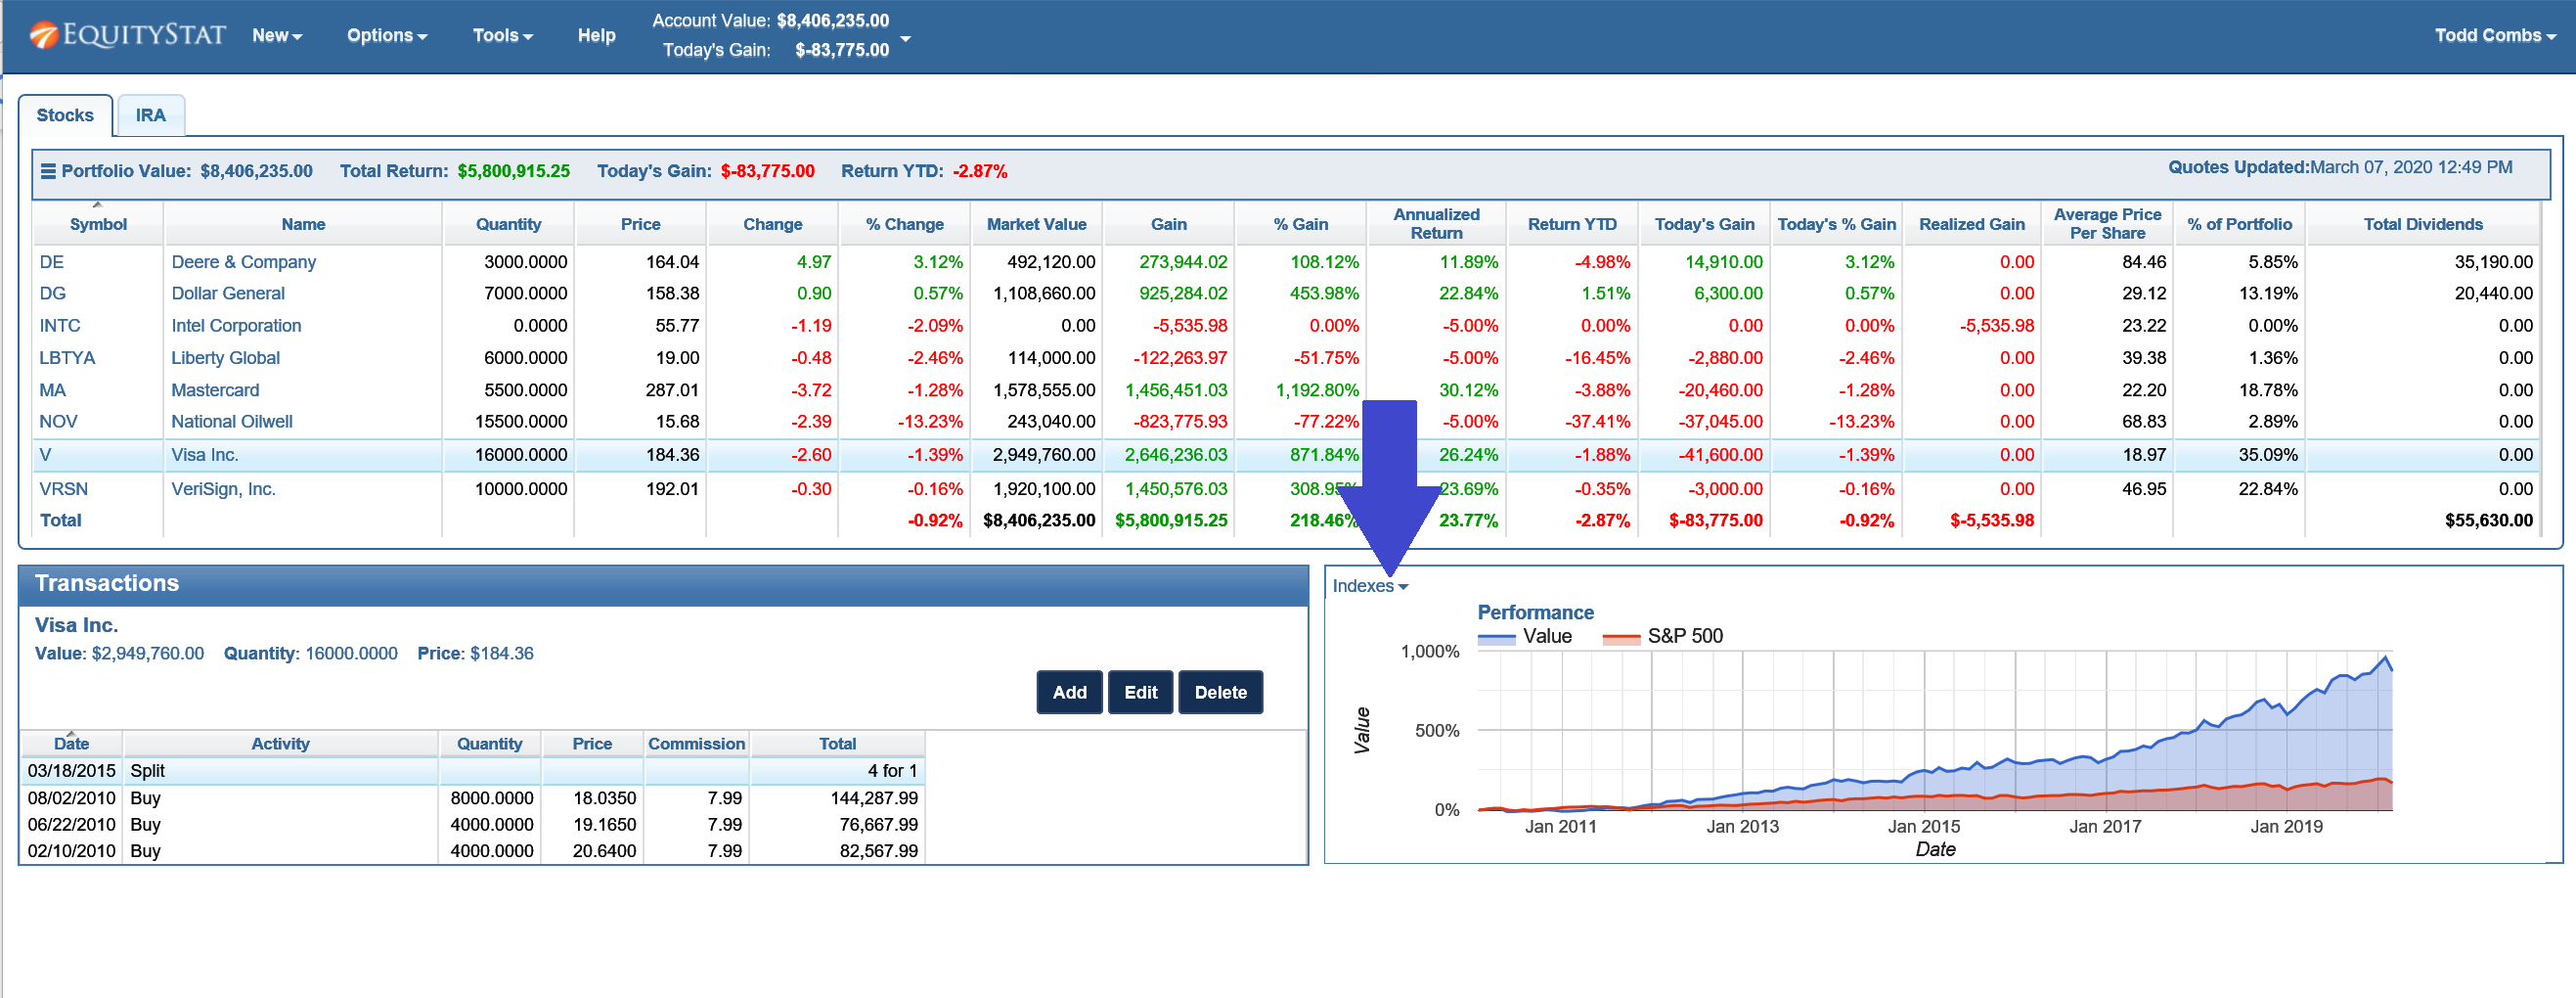
If you want to see how your investment performance is doing compared to an index, you can easily add an index to your investment’s performance graph.

To do this, select the index you want to compare, by clicking on the Indexes drop down menu link in the upper left hand corner of the performance graph.

Compare Stock Performance to Indexes
Compare Investment Performance to Indexes

When you click on the Indexes drop down menu link, you can choose from a list of indexes.

Choose to compare your stock's performance to the Dow Jones index, the Nasdaq index or the S&P 500 index
Choose to compare your stock’s performance to the Dow Jones index, the Nasdaq index or the S&P 500 index

Choose the Dow Jones index, the Nasdaq index or the S&P 500 index. You can choose one index or multiple indexes. When you choose an index, you will see a checkbox next to the index.

Once an index is chosen, you will see the index in your performance graph and how it compares to your investment’s performance.

To remove an index, click on the Indexes drop down link and select the index again. This will remove the checkbox from the index menu item and remove the index from your performance graph.

You can also compare your account/portfolio performance to an index. To do this, go to the Portfolio Analysis page by choosing the Tools menu at the top and selecting Analyze Portfolio from the drop down menu. From the Portfolio Analysis page, click the Indexes link above the performance graph and choose the index or indexes you want to compare.

Choose to compare your account/portfolio performance to the Dow Jones index, the Nasdaq index or the S&P 500 index

Google Finance Portfolio Is Gone, Here’s What to Do

If you’re searching for your Google Finance portfolio and can’t find it, you are not alone. Google discontinued the portfolio tracking feature inside Google Finance, and searches for “my portfolio” on Google Finance now come up empty for a lot of former users. This guide covers what happened, whether your data is still accessible, and how to move your investment history into a dedicated stock portfolio tracker like EquityStat.

What Happened to Google Finance’s Portfolio Feature?

Google Finance used to let you build and track an investment portfolio directly on the site, logging your holdings and watching their performance alongside market data. That feature has been discontinued. Google Finance today still shows stock quotes, charts, and market news, but it no longer supports the portfolio tracking tool that many investors relied on for years.

Can You Still View or Access Your Google Finance Portfolio?

If you built a portfolio in Google Finance before the feature was removed, you generally can no longer view or manage it through the Google Finance interface itself. There isn’t a way to log back in and see your old portfolio the way it used to appear. The good news is that your underlying transaction data isn’t necessarily lost. If you exported or downloaded your transactions before the feature was removed, or if you still have access to the export tool, you can use that data to rebuild your portfolio somewhere else, which is exactly what the steps below walk through.

What Data Transfers When You Export From Google Finance

When you export your Google Finance transactions, you’re getting a spreadsheet of your recorded buys, sells, and other transaction history, not a full copy of your account or your original portfolio layout. That means things like custom watchlist groupings or notes you may have added won’t carry over. What does carry over, and what actually matters for tracking performance going forward, is your transaction history: the trades that determine your holdings, cost basis, and gains or losses. That’s the data EquityStat needs to rebuild an accurate portfolio on your behalf.

How to Import Your Google Finance Portfolio into EquityStat

If you’re looking for an alternative to Google Finance’s discontinued portfolio manager, you can import your existing transaction history directly into EquityStat. Here’s how.

Step 1: Export your transactions from Google Finance

Log in to your Google Finance portfolio and locate the Transactions link. From there, use the download or export option to save your transaction history as a spreadsheet file to your computer.

On the Google Finance transactions page, click the Download to Spreadsheet link and save the downloaded file to your hard drive.

Step 2: Log in to your EquityStat account

If you don’t already have an EquityStat account, you can create one for free before continuing.

Step 3: Start the import

In EquityStat, click the New menu at the top of the screen and choose Import Transactions from the dropdown.

Step 4: Upload your file

On the import page, click Browse to locate the spreadsheet file you saved in Step 1, then click Import to load it.

Step 5: Review and confirm

EquityStat will show you a summary of the transactions it’s about to import. Review the summary, correct any errors it flags, and once everything looks right, click Import Data to finish bringing your Google Finance transaction history into EquityStat.

What You Get Once Your Data Is Imported

Once your transaction history is in EquityStat, you are not just looking at a static copy of your old Google Finance portfolio. You get a working stock portfolio tracker – real-time price updates, performance metrics like annualized return and year-to-date return, dividend tracking, and benchmark comparisons against the S&P 500, Dow Jones, and Nasdaq, all of which Google Finance’s portfolio tool never offered.

Google Finance Portfolios Are Going Away, Here is the Best Alternative

Google Finance Is Discontinuing Its Portfolio Manager

Google has officially discontinued the Google Finance stock portfolio manager, leaving many investors searching for a reliable alternative. If you relied on Google Finance to track your stocks, ETFs, or mutual funds, EquityStat offers a powerful, easy‑to‑use replacement with many of the same features and more.

Why EquityStat Is a Strong Alternative for Google Finance Portfolios

EquityStat provides a clean, intuitive interface designed for investors who want accurate performance tracking without complexity.

Key Features Comparable to Google Finance

  • View the total value of your portfolio
  • Track daily gain/loss
  • See percentage gain since purchase
  • Review realized gains
  • View annualized return for each investment
  • Track stocks, ETFs, and mutual funds
  • Access complete transaction history for each holding

EquityStat gives you the same visibility you had in Google Finance, plus deeper analytics.

Importing Your Google Finance Portfolio Into EquityStat

Transitioning from Google Finance is simple.

You can import your portfolio by:

  • Manually entering transactions, or
  • Uploading a spreadsheet with your historical data

If you need help, here is an article that explains how to import your investment data from Google’s portfolios.

More Tools to Manage and Analyze Your Portfolio

EquityStat includes additional features that go beyond what Google Finance offered:

  • Create multiple portfolios
  • View performance graphs over time
  • Analyze portfolio holdings and allocation
  • Edit or delete transactions at any time
  • Track performance across all your investments in one place

These tools help you understand your portfolio’s performance with greater accuracy and detail.

Why Investors Choose EquityStat To Replace Google Finance

  • Simple, fast, and user‑friendly
  • Accurate performance calculations
  • Ideal for long‑term investors and active traders
  • Built specifically for stock, ETF, and mutual fund tracking
  • A dependable replacement for Google Finance’s discontinued portfolio manager

If you miss the old Google Finance portfolio tool, EquityStat is one of the best alternatives available today.

Print Your Stock Portfolio

How to Print Your Portfolio

To begin, open your EquityStat account and navigate to the Tools menu located at the top of the screen. From the dropdown list, select Print Portfolio. This will take you to a dedicated printing page designed specifically for generating portfolio reports.

Choose What You Want to Print

On the print page, you’ll see options that let you decide exactly which portfoli, or portfolio you want to include.

  • You can print a single portfolio if you only need information for one set of investments.
  • Or, if you manage several portfolios, you can choose to print all of them at once, making it easy to create a complete snapshot of your entire investment landscape.

This flexibility is especially helpful for users who track different strategies, accounts, or goals and want a consolidated view.

Generate a PDF

Print your EquityStat Stock Portfolio to a pdf and send to your printer.
Print Portfolio Screenshot

Once you’ve selected your portfolio(s), click the Print button. EquityStat will automatically generate a PDF file containing your portfolio details. From there, you can:

  • Print the PDF directly to your home or office printer
  • Save the file to your computer for record‑keeping
  • Email or share the PDF with advisors, accountants, or anyone else who needs access

The PDF format ensures your portfolio is neatly formatted, easy to read, and consistent every time you print it.

Enhancing EquityStat to Better Support Modern Investors

The addition of this print feature is just one example of how we continue to evolve EquityStat to meet the needs of modern investors. Many users rely on printed reports for meetings, tax preparation, long‑term planning, or simply for peace of mind. By offering a fast, reliable way to generate PDFs or hard copies of your portfolios, we aim to make your investment management experience smoother, more flexible, and better aligned with the way you prefer to work.


EquityStat: The Best Alternative to the Yahoo Finance Portfolio Manager

Many investors today are searching for a reliable alternative for the Yahoo Finance portfolio manager. Over the years, Yahoo Finance has made several changes to its stock tracking tools, changes that have frustrated long‑time users who depend on accurate, fast, and intuitive portfolio tracking. If you’ve been struggling with the Yahoo Finance stock portfolio tracker, you are not alone. Thousands of investors are looking for a better solution.

That’s exactly where EquityStat stands out.

EquityStat was built by investors, for investors. Our goal has always been to create a powerful, clean, and easy‑to‑use portfolio manager that gives you more control, more data, and a better overall experience than Yahoo Finance.

EquityStat was founded by investors. As investors we understand what other investors are looking for in a portfolio manager. For example, one of our goals was to make EquityStat’s Portfolio manager show as much information on your screen without you having to constantly scroll around to see your data. Unlike Yahoo, EquityStat does not show ads, so this gives us more room to show more information about your investments and how they are performing.

EquityStat Financial Stock Portfolio
Stock Portfolio Example

Why Investors Are Moving Away from the Yahoo Finance Portfolio Manager

The Yahoo Finance portfolio manager has historically been popular, but recent updates have made the tool less efficient for serious investors. Common complaints include:

  • Cluttered screens filled with ads
  • Slow loading times
  • Missing or removed features
  • Limited customization
  • Reduced visibility of important data

For investors who track multiple stocks, ETFs, mutual funds, or long‑term positions, these limitations can make daily portfolio management frustrating.

This is why so many users are actively searching for a better Yahoo Finance stock portfolio tracker alternative—and discovering EquityStat.

EquityStat: A Better, Smarter Stock Portfolio Tracker

EquityStat’s portfolio manager was designed to solve the problems investors face with Yahoo Finance. Instead of ads, clutter, and limited data, EquityStat focuses on clarity, speed, and usability.

1. A Clean, Ad‑Free Interface

Unlike the Yahoo Finance portfolio manager, EquityStat does not display ads. This gives you more screen space, faster load times, and a cleaner view of your investments.

2. More Data on Your Screen

One of the biggest complaints about Yahoo Finance is how much scrolling is required to see your full portfolio. EquityStat solves this by displaying more information at once, allowing you to analyze your holdings without constantly moving around the page.

3. Built by Investors Who Understand Your Needs

EquityStat was created by people who actively invest. We know what matters:

  • Clear performance metrics
  • Easy navigation
  • Fast updates
  • Accurate data
  • Customizable portfolio columns

Every feature is designed to help you make smarter investment decisions.

4. A Better Long‑Term Portfolio Tracking Experience

EquityStat gives you the tools you need to track performance over time, monitor gains and losses, and understand how your investments are performing, without the limitations of the Yahoo Finance stock portfolio tracker.

We Want to Improve Even More — Tell Us What You Need

If there is a feature you liked in the Yahoo Finance portfolio manager that EquityStat does not yet include, we want to hear about it. Our development roadmap is driven by user feedback, and we take every suggestion seriously.

Our mission is simple: Build the best stock portfolio tracker for investors who want accuracy, clarity, and control.

Try EquityStat Today — A Better Alternative to Yahoo Finance

If you’re looking for a powerful, clean, and reliable replacement for the Yahoo Finance stock portfolio tracker, EquityStat is ready for you. Experience a portfolio manager that actually works the way investors need it to.

Yahoo Finance Stock Portfolio Tracker Changes, Best Alternatives and How EquityStat Compares

Yahoo Finance Has Changed Its Stock Portfolio Tracker

Yahoo Finance recently updated its stock portfolio tracker, and many long‑time users are finding the new version harder to use or missing key features. If you relied on Yahoo Finance to track your stocks, ETFs, or mutual funds, EquityStat offers a powerful, easy‑to‑use alternative with more flexibility and better performance tracking.

Why Many Investors Are Looking for a Yahoo Finance Alternative

Yahoo Finance’s portfolio manager was once one of the most popular online tools for tracking investments. But recent changes have removed features, altered layouts, and made the interface less intuitive for many users.

If you’re searching for a replacement that feels familiar but offers more control, EquityStat is designed for exactly that.

EquityStat: A Modern, Feature‑Rich Alternative to Yahoo Finance Portfolio Tracker

EquityStat includes many of the same features Yahoo Finance users expect, plus several advanced tools Yahoo does not offer.

Core Features Similar to Yahoo Finance

  • Track stocks, ETFs, and mutual funds
  • View current portfolio value
  • Monitor daily gain/loss
  • See percentage gain since purchase
  • Review realized gains
  • Access full transaction history
  • View your portfolio on a previous date

These features make the transition from Yahoo Finance smooth and familiar.

Features EquityStat Offers That Yahoo Finance Investment Portfolio Does Not

EquityStat includes several powerful tools that go beyond Yahoo’s capabilities:

1. Clear, At‑a‑Glance Portfolio Performance

At the top of your dashboard, you immediately see:

  • Total portfolio value
  • Total return
  • Today’s gain/loss

No extra clicks. No digging through menus.

2. Create Multiple Portfolios

Organize your investments into separate portfolios such as:

  • Personal brokerage
  • 401(k) or IRA
  • Joint accounts
  • Taxable vs. tax‑advantaged accounts

Track each portfolio individually or view your entire account’s performance.

3. Less Scrolling, More Data

EquityStat automatically adjusts to your screen size, making it easier to view all your data without endless scrolling, something Yahoo’s layout struggles with.

4. Detailed Performance Calculations

For each investment, portfolio, and your overall account, you can view:

  • Current market value
  • Total gain
  • Today’s gain
  • Annualized return
  • Cost basis
  • And more

These metrics help you understand exactly how your investments are performing.

5. Full Transaction Management

For each investment, you can easily:

  • View all transactions
  • Add new transactions
  • Edit existing entries
  • Delete incorrect entries

Everything is grouped neatly for fast access.

6. Hide or Show Sold Investments

Toggle between:

  • A clean view of current holdings, or
  • A full historical view including sold positions

Perfect for tax planning and performance review.

7. Customize Your Portfolio Columns

Add or remove data columns such as:

  • Return YTD
  • Annualized Return
  • Dividend yield
  • Market value
  • Cost Basis

Build the exact view you want, something Yahoo Finance does not allow.

8. Import Your Data Easily

Upload your transactions using:

  • A spreadsheet
  • A CSV file

No need to re‑enter years of history manually.

9. Generate IRS Tax Forms

If you sold investments, EquityStat can generate IRS Form 8949, which tax preparers use to calculate capital gains. Yahoo Finance does not offer this.

10. Export Your Data for Safekeeping

Download your transactions to a spreadsheet for backup or offline analysis.

11. 24/7 Support

Have a question? EquityStat’s support team is available 24 hours a day, 7 days a week.

12. Works on Any Device

Because EquityStat is built with modern web technology, you can access your portfolio on:

  • Desktop
  • Laptop
  • Tablet
  • Mobile phone

No plugins. No compatibility issues.

EquityStat and Taxes

It’s that dreaded time of year – tax time. EquityStat’s portfolio manager has several tools to help investors with their taxes.

If you sold any shares last year, you can use EquityStat to generate IRS Form 8949.  IRS Form 8949 is a form that shows your short-term  and long-term capital gains on any investment sale.  EquityStat will automatically calculate these capital gains.  It will then generate a PDF of Form 8949 with all needed information that the IRS requires.  You can then give this form to your tax preparer when you are preparing your taxes.  To generate IRS Form 8949, click the Tools menu and then choose the Generate Form 8949 menuitem.

Use EquityStat To Print IRS Form 8949
IRS Form 8949 Example

Another tool to help you with your taxes is the ability to export your investment’s transactions to a spreadsheet. To export your transactions, click the Tools menu and then choose the Export Transactions menuitem. When you export your transactions, you will get a spreadsheet showing each transaction for the investment including the type of transaction it is (e.g. Buy, Sell, Dividend, etc). With this information, your tax preparer can calculate your taxable capital-gains and taxable dividends for all of your investments.

EquityStat Receives Nomination for Benzinga Fintech Award

EquityStat is proud to announce that it has been nominated for a technology award in the annual Benzinga Fintech Awards, a nationally recognized program that highlights the most innovative companies shaping the future of financial technology. This nomination reflects EquityStat’s commitment to delivering a clear, unified, and accessible portfolio‑tracking experience for investors.

About Benzinga

Benzinga is one of the leading financial media and data companies in the United States. Known for its fast, actionable market news and deep coverage of fintech innovation, Benzinga reaches millions of investors, traders, and financial professionals every month. The platform is widely respected for identifying emerging technologies and spotlighting companies that are transforming how people interact with financial markets.

About the Benzinga Fintech Awards

The Benzinga Fintech Awards recognize companies that are redefining the financial services industry through technology, accessibility, and user‑focused design. The awards highlight platforms that:

  • Improve the investing experience
  • Increase financial transparency
  • Simplify complex financial tasks
  • Empower everyday investors
  • Advance innovation in fintech

A nomination places a company among the most forward‑thinking and impactful fintech innovators in the market.

Why EquityStat Was Nominated

EquityStat was nominated for its ability to solve one of the most persistent challenges facing modern investors: fragmented investment data spread across multiple accounts and institutions. The platform provides a unified, real‑time portfolio‑tracking solution that allows users to view all their holdings in one place.
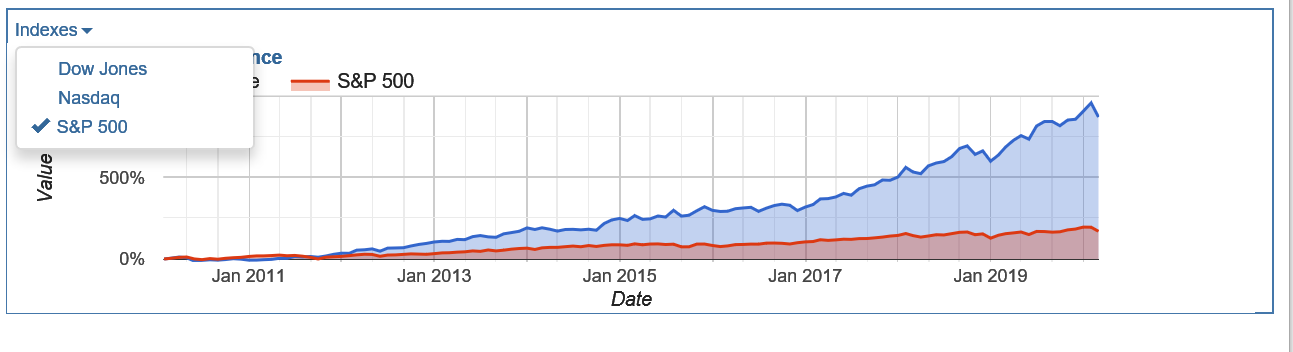
Key capabilities highlighted in the nomination include:

  • A single dashboard for all investment accounts
  • Real‑time stock, ETF, and mutual fund quotes
  • Automatic portfolio valuation
  • Performance tracking for each individual investment
  • Historical charts and long‑term performance trends
  • A clean, intuitive interface accessible from any device

This nomination underscores EquityStat’s mission to make investment tracking simple, accurate, and accessible for all investors.

Click here to read the full article.


Worst Stock of 2016

According to the Wall Street Journal the worst S&P 500 stock of 2016 was Endo International.  It was down 73%.

You can see the list of worst stocks here:

http://blogs.wsj.com/briefly/2016/12/30/5-worst-performers-in-the-sp-500-in-2016/

How did your investments do in 2016?  What was your worst stock?  If you are not tracking your investment’s performance, consider using EquityStat.  With EquityStat you can track the overall performance of your portfolio/account as well as the performance of each individual investment.  EquityStat tracks the annualized return, year to date return, daily gain, overall gain and many other metrics of your investments.  With these metrics you can easily determine what are your best investments.

Many online brokerages and mutual funds track an individual stock or mutual fund’s performance but you cannot get the overall return of all your stocks or mutual funds.  With EquityStat not only can you get the return each investment, you can also get the return for your entire account.  This way you know how well your investments are performing at any time.

Best Stock of 2016

According to the Wall Street Journal the best S&P 500 stock of 2016 was Nvdia.  It was up 224%.

You can see the list of best stocks here:

http://blogs.wsj.com/briefly/2016/12/30/5-best-performers-in-the-sp-500-in-2016/

How did your investments do in 2016?  What was your best stock?  If you are not tracking your investment’s performance, consider using EquityStat.  With EquityStat you can track the overall performance of your portfolio/account as well as the performance of each individual investment.  EquityStat tracks the annualized return, year to date return, daily gain, overall gain and many other metrics of your investments.  With these metrics you can easily determine what are your best investments.

Many online brokerages and mutual funds track an individual stock or mutual fund’s performance but you cannot get the overall return of all your stocks or mutual funds.  With EquityStat not only can you get the return each investment, you can also get the return for your entire account.  This way you know how well your investments are performing at any time.


How to Track Cash Transactions in Your Investment Portfolio

Tracking cash transactions in your investment portfolio gives you a complete picture of your account, not just the shares you hold. Besides your stocks, ETFs, and mutual funds, a portfolio also includes the cash sitting in the account, and now that cash can be tracked directly alongside your investments.

How to Add a Cash Transaction

To add a cash transaction, click the New menu and choose New Cash Transaction from the dropdown. In the popup dialog, enter the date of the transaction and the amount, then save it. The transaction is added to your portfolio’s cash balance right away.

Adding a cash transaction to an EquityStat investment portfolio

How Cash Transactions Work with Dividends

To have dividends flow into your cash balance automatically, two settings need to be turned on From there, turn on “Enable Cash Transactions”, and also turn on “Dividend Transactions Deposit Into Cash”. Once both of these preferences are turned on, any dividends from your other investments that are not reinvested will be added to your cash balance automatically. This means you do not have to manually log every dividend payout as a separate cash deposit. If a dividend is paid out rather than reinvested, it flows into your cash total on its own, keeping your overall portfolio value accurate without extra work on your part.

Why Tracking Cash Matters

Cash is often the piece investors forget to account for. A portfolio that only tracks stocks, mutual funds and ETFs can understate your actual holdings, especially if you regularly receive dividends that are not reinvested or if you hold cash between trades. Recording cash transactions closes that gap, so your total portfolio value reflects everything you actually have, not just what is invested in the market at any given moment.

Portfolio Analysis – New Feature

How to Analyze Your Investment Portfolio in EquityStat

EquityStat has introduced a powerful Portfolio Analysis tool that helps investors evaluate performance, track holdings, and compare returns across multiple portfolios. This feature gives you a clear, data‑driven view of how your investments are performing over time.

What the Portfolio Analysis Tool Does

The Portfolio Analysis page provides a complete performance overview of your account and individual portfolios. You can quickly see:

  • Overall account performance over time
  • Portfolio‑level performance metrics
  • Investment holdings and allocation
  • Daily, quarterly, and yearly performance rankings
  • Best‑ and worst‑performing investments

This makes it easy to understand which assets are driving your returns and where adjustments may be needed.

How to Access Portfolio Analysis in EquityStat

To run a portfolio analysis:

  1. Click the Tools menu at the top navigation bar.
  2. Select Analyze Portfolio from the dropdown.
  3. The system will generate a detailed analysis of your account and portfolios.

What You’ll See on the Portfolio Analysis Page

Analyze your investment portfolio using EquityStat.
Analyze Portfolio Example

1. Account‑Level Performance Overview

If you manage multiple portfolios, the analysis begins with a full account‑wide performance summary, including:

  • A performance graph showing account growth over time
  • A breakdown of each portfolio’s performance
  • A ranked list of investment returns
  • A summary of all holdings across your account

2. Portfolio‑Specific Analysis

Click any portfolio name in the summary table to view:

  • Portfolio‑specific performance charts
  • Individual investment metrics
  • Best and lowest performers for the day, quarter, and year
  • A complete holdings list for that portfolio

If you only have one portfolio, the system automatically displays its analysis.

Key Performance Metrics Provided

The analysis includes detailed metrics such as:

  • Total return
  • Daily return
  • Quarterly return
  • Year‑to‑date return
  • Investment rankings
  • Growth charts

These insights help you understand how each investment contributes to your overall performance.

Why This Matters for Investors

Whether you’re a beginner or an experienced investor, having a clear view of your portfolio’s performance is essential. EquityStat’s Portfolio Analysis tool helps you:

  • Track long‑term investment growth
  • Identify top‑performing investment
  • Spot underperforming investments
  • Make informed decisions based on real data
  • Manage multiple portfolios with ease
  • Track dividend income across all portfolios

Stock Portfolio Tracker FAQ 5 Common EquityStat Questions Answered

This stock portfolio tracker FAQ covers the five questions EquityStat users ask most often, from adding your first investment to selling shares and customizing how your portfolio is displayed. Whether you are just getting started or have been tracking your investments for a while, these answers should help you get more out of the tool.

1. How Do I Add a New Investment?

Click the New menu, then choose New Investment from the dropdown. A popup dialog will appear where you can enter the details of your new investment, including the symbol, the number of shares, and the price. Once you save it, the investment is added to your portfolio and its price will begin updating automatically.

2. How Do I Add or Remove a Portfolio Column?

Click the Options menu, then choose Change Columns from the dropdown. The Change Columns panel will appear with two lists, Available Columns and Displayed Columns. To add a column, select it from the Available Columns list and click Add to move it into the Displayed Columns list. To remove a column, select it from the Displayed Columns list and click Remove. When you are finished, click Change to save your new column layout.

This is useful for tailoring your portfolio view to whatever matters most to you, whether that is dividend yield, annualized return, or cost basis.

3. How Do I Change the Order of the Displayed Columns?

Change your stock portfolio columns to show the metrics that matter to you

Click the Options menu and choose Change Columns, the same panel used to add or remove columns. Select the column you want to move from the Displayed Columns list, then use the up and down arrows on the right side of the panel to reposition it. Click Change when you are done to save the new order. This lets you put the metrics you check most often, such as gain or current value, right where you will see them first.

4. How Do I Sort My Portfolio by Investment Name or Any Other Column?

To sort your portfolio by investment name, click the Name column heading. The same works for any other column, including Market Value, Gain, or Return. Clicking a column heading once sorts it, and clicking it again toggles between ascending and descending order, so you can quickly see your biggest winners, your biggest losers, or your largest positions.

5. How Do I Sell an Investment?

To sell an investment, add a Sell transaction. First, select the investment you want to sell, then click the Add button in the Transactions section. A popup panel will appear where you can enter the date, choose Sell from the Activity dropdown, and enter the number of shares sold along with the price. Click Add to save your changes, and EquityStat will update your holdings and performance numbers to reflect the sale.

Still Have Questions

If this stock portfolio tracker FAQ did not answer what you were looking for, reach out through the help page for more support.

New Column Options

We recently added two new column options to our portfolio manager.  You can now display the Ex-Dividend Date and Dividend Paid Date for each of your investments.  To display these columns in your portfolio, click the Options menu and then choose the Change Columns menuitem.  A drop down panel will then appear.  Select the column from the list of Available Columns and add it to the list of Displayed Columns.  Click the Change button and your new columns will display in the portfolio.

In addition to these two columns, we provide a whole range of other columns you can add to your portfolio.  These columns vary from information about your investment to performance metrics.  Just add/remove the columns to configure your portfolio to your specifications.

Yahoo Portfolio No Longer Supports Transactions

If you haven’t heard, Yahoo’s investment portfolio manager will no longer be supporting transactions. This means that if you want to record all of your buys, sells, dividends, etc., you can no longer do so with Yahoo’s investment portfolio.  In other words, you can no longer track the history of your investments.  Without a transaction history you cannot get an accurate performance return of your investment and you can’t calculate your gains and losses for your taxes.  If you are a user of Yahoo’s portfolio manager and want an alternative, consider EquityStat’s portfolio manager.

With EquityStat you can easily add, edit and delete your investment transactions. You can also easily view your transactions for each investment.  In addition you can import these transactions into your portfolio by either manually entering them or importing them from a spreadsheet. If you want to save your transactions to your computer, you can export the transactions for each investment to a spreadsheet.

If you are looking for  portfolio manager that supports transactions, checkout EquityStat.

How to Track Your Stock’s Performance Over Time in EquityStat

A single number can only tell you so much about an investment. Knowing that a stock is up twelve percent this year does not tell you whether it climbed steadily or whether it dropped hard in the spring and clawed its way back by December. To really understand how an investment has behaved, you need to see it over time, not just where it stands today.

That is what a performance graph gives you, and it is built right into the EquityStat portfolio manager for every stock, ETF, and mutual fund you track.

Why a Graph Tells You More Than a Return Percentage

A return percentage answers one question. It tells you where you ended up. It does not tell you how bumpy the ride was to get there, whether the gains came early or late, or how the investment behaved during a market pullback. A performance graph fills in that missing context. You can see the shape of an investment’s history at a glance, which makes it much easier to judge how it actually fits your goals and how comfortable you are holding it through the next downturn.

How to View a Performance Graph in EquityStat

Pulling up the graph for any investment takes only a couple of clicks.

  1. Open the portfolio that contains the investment you want to review.
  2. Click on the individual stock, ETF, or mutual fund in the investment pane.
  3. The performance graph appears at the bottom right of the screen, right next to transaction pane.
EquityStat Portfolio Manager Stock Performance Graph
Performance graph for an individual stock in the EquityStat portfolio manager, shown next to the transaction history for that investment


From there you can see the investment’s price movement over time without leaving the page or pulling up a separate chart tool.

Compare Your Investments to the Market

Seeing a graph in isolation only tells part of the story. EquityStat also lets you compare the performance of an individual investment against the S&P 500, the Dow Jones, and the Nasdaq indexes, so you can quickly tell whether a stock is genuinely outperforming the market or simply moving with it. This kind of comparison is one of the fastest ways to separate a truly strong pick from one that just happened to rise along with everything else.

See Your Whole Portfolio’s Performance at Once

Individual investment graphs are useful, but sometimes you want the bigger picture. EquityStat also provides summary performance graphs for your entire account, along with the same kind of market comparison against major indexes, so you can judge how your overall strategy is doing, not just how one holding is doing.

Pulling it up takes only a couple of clicks as well.

  1. Click the Tools menu at the top of the page.
  2. Choose Analyze Portfolio from the drop down menu.
  3. The account performance graph will be at the top of the page.

From there you can see how your entire account has moved over time, right alongside the same kind of index comparison available for individual investments.

Why This Matters for Long Term Investors

If you hold investments for years rather than days, a single snapshot of your returns will only tell you so much. Watching how an investment has actually moved, and how it stacks up against the broader market, gives you a much clearer sense of whether it deserves a place in your portfolio going forward. It also makes it easier to stay calm during a rough stretch, since you can see that a dip today is often just one point on a much longer line.

Frequently Asked Questions

How do I see the performance graph for a specific stock in EquityStat? Open the portfolio that contains the investment, click on that investment in your list, and the performance graph will appear next to its transaction history.

Can I compare my investments to the S&P 500 or other indexes? Yes. EquityStat lets you compare the performance of an individual investment, as well as your entire portfolio, against the S&P 500, the Dow Jones, and the Nasdaq.

Does EquityStat show performance for my whole portfolio, not just one stock? Yes. In addition to graphs for individual investments, EquityStat provides a summary performance graph for your entire account.

How do I see the performance graph for my whole account? Click the Tools menu at the top of the page, choose Analyze Portfolio from the drop down menu, and the account performance graph will be at the top of the page.

Ditch the Stock Spreadsheet: A Better Way to Track Your Stock Portfolio

Plenty of investors keep their stock portfolio in a spreadsheet, usually in Excel or Google Sheets. It is a familiar tool, it lets you calculate a few performance numbers on your own, and it gives you a quick way to check your net worth without logging into every brokerage site you own an account with. It also feels private, since the file lives on your own computer and nobody else can open it.

That familiarity comes at a real cost, though. Once you look closely at what an Excel or Google Sheets spreadsheet cannot do, the drawbacks start to add up.

The Problem With Keeping Your Prices Current

A stock spreadsheet in Excel or Google Sheets is only as accurate as its most recent price update, and updating it is on you. Enter prices by hand every day and it becomes a small chore that eats a few minutes you probably would rather spend somewhere else. Try to automate it with a stock data service instead, and now you are relying on a formula or add in that can break the moment that service changes its interface or goes down for a day. Either way, you are the one responsible for keeping the numbers honest.

The Problem With Being Tied to One Computer

A spreadsheet also only exists in one place. If your Excel file lives on your home computer, you cannot pull it up at work. If you use a laptop, a desktop, and a tablet at home, the file usually lives on just one of them, and you are stuck checking your portfolio only when you happen to be sitting in front of that particular machine. Google Sheets solves some of this since it lives online, but you are still stuck rebuilding the same manual formulas and price lookups no matter which device you open it from.
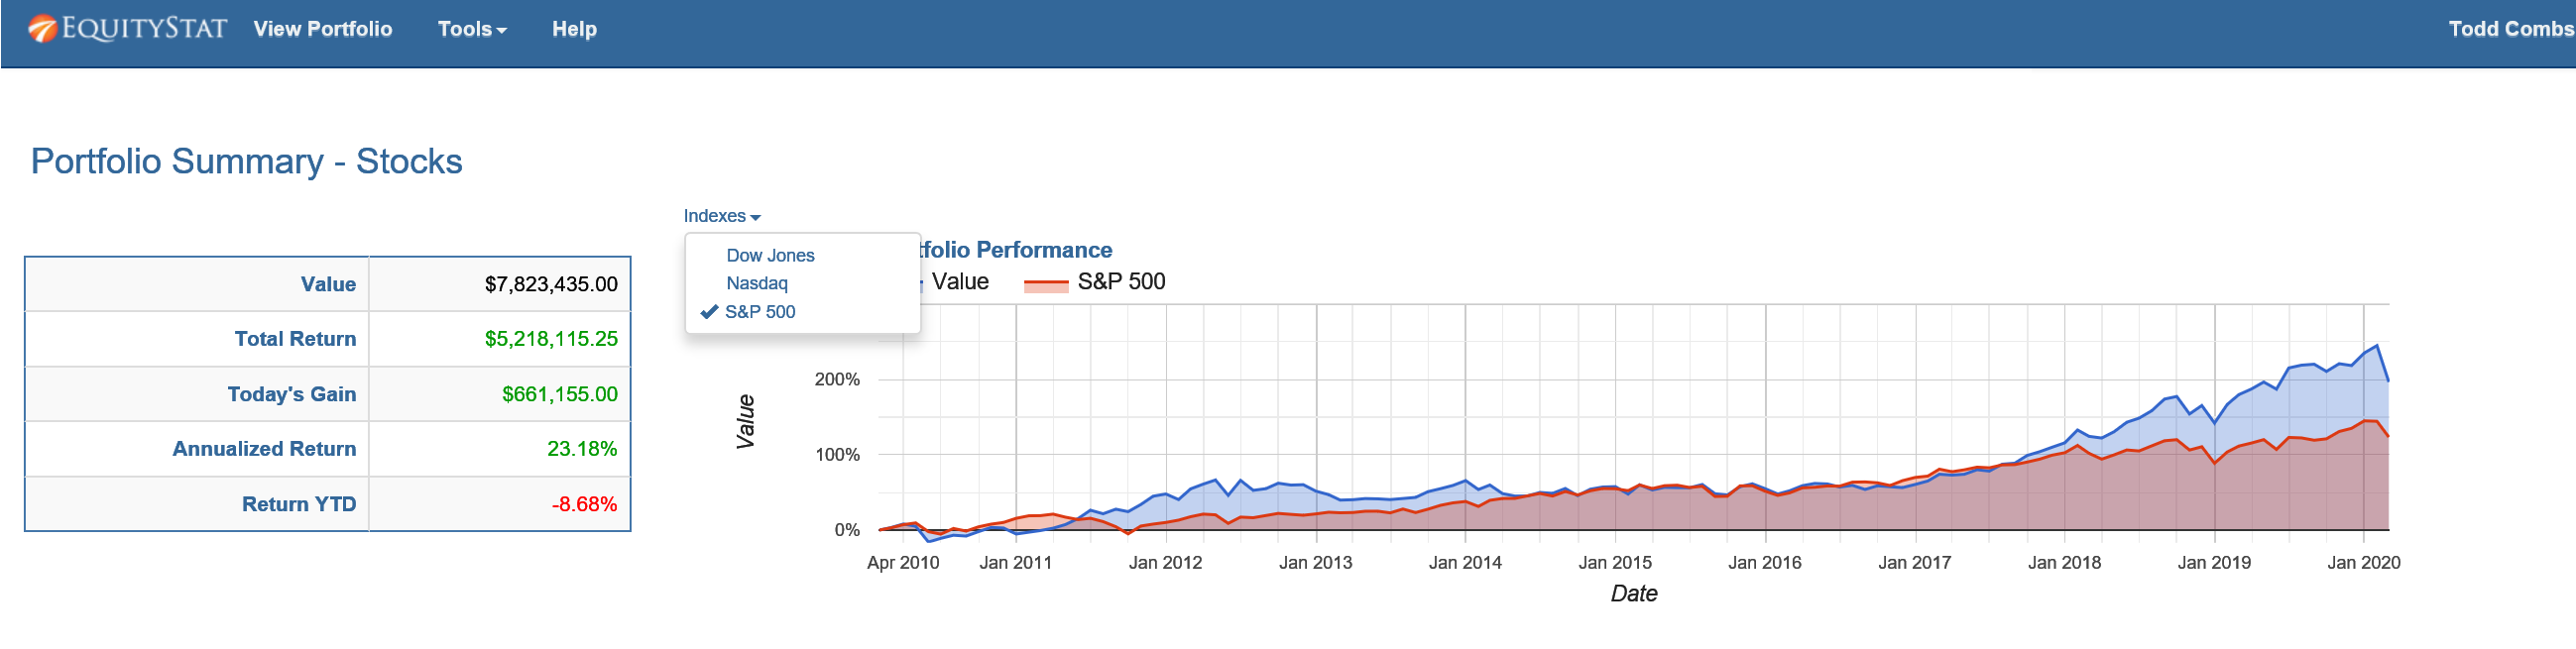
A Better Way to Track Your Portfolio

EquityStat was built to solve exactly these problems. Your portfolio’s value updates on its own, since EquityStat handles pulling in near real time prices for you, so there is no more typing numbers into cells every morning and no formula to babysit the way you would in Excel or Google Sheets.

Because EquityStat lives in the cloud rather than on one hard drive or inside one Google account, you can pull up your portfolio from any computer or device with a web browser, at home, at work, on a Windows machine, a Mac, or an iPad, any time of day. You are never stuck waiting to get back to one specific desk just to check how your investments are doing.

As for the privacy concern that makes a spreadsheet feel safe, EquityStat does not ask for your brokerage passwords the way some other portfolio tools do. You enter your holdings and transactions yourself, so your login credentials for your actual brokerage accounts never leave your hands.

What You Get Beyond a Spreadsheet

Along with automatic pricing and access from anywhere, EquityStat calculates the performance metrics that are genuinely tedious to build correctly in an Excel or Google Sheets spreadsheet on your own, including annualized return, year to date return, quarterly return, and average price per share. These are the same numbers serious investors want to track, without the manual formula work.

2015 8949 IRS Tax Forms Released

We just released the 2015 8949 IRS tax forms. If you have sold any stocks or mutual funds in 2015, then you can generate IRS Form 8949 to calculate your gain or loss on a stock sale. EquityStat will automatically calculate your short-term gains and losses and long-term gains and losses and generate a PDF 8949 form. You can then save or print out this form and give it to your accountant or tax preparer. To generate Form 8949 click the Tools menu and then select the Generate Form 8949 menuitem.

Best and Worst Stocks of 2015

According to the Wall Street Journal the best stock of 2015 was Netflix.  It was up 134%.  The worst stock of 2015 was Chesapeake Energy.  It was down 77%.

You can see the list of best stocks here:

http://blogs.wsj.com/briefly/2015/12/31/5-best-performers-in-the-sp-500-in-2015/

You can see the list of worst stocks here:

http://blogs.wsj.com/briefly/2015/12/31/5-worst-performers-in-the-sp-500-we-only-counted-energy-stocks-once/

How did your investments do in 2015?  What was your best stock?  What was your worst? If you are not tracking your investment’s performance, consider using EquityStat.  With EquityStat you can track the overall performance of your portfolio as well as the performance of each individual investment.  EquityStat tracks the annualized return, year to date return, daily gain, overall gain and many other metrics of your investments.  With these metrics you can easily determine what are your best investments and what are your worst investments.

New in EquityStat: Multiple Portfolios, Expanded Performance Metrics, and a Maximize View

Managing investments effectively requires tools that are flexible, intuitive, and powerful enough to handle real-world portfolios. These enhancements to EquityStat’s Portfolio Manager adds three specific improvements: the ability to create multiple portfolios, three new performance metrics (quarterly return, P/E ratio, and dividend yield), and a Maximize Portfolio view that expands your investment list to fill more of the screen. Together, these changes make it easier to organize multiple accounts, analyze performance more deeply, and view your investment data in a cleaner, more streamlined layout.

Whether you’re tracking stocks, mutual funds, ETFs, or retirement accounts, these new features help you stay on top of your financial picture with greater accuracy and efficiency.

Create and Manage Multiple Portfolios with Ease

One of the most significant upgrades is the ability to create multiple portfolios within your EquityStat account. This feature is ideal for investors who want to separate or categorize their holdings across different accounts or investment strategies.

Why Multiple Portfolios Matter
  • Better organization – Keep your brokerage accounts, retirement accounts, and long‑term holdings separate.
  • Clearer insights – Compare performance between strategies (e.g., growth vs. income).
  • Simplified reporting – Generate cleaner summaries for taxes, advisors, or personal tracking.

How to Create a New Portfolio

You can create a new portfolio directly from the New menu by selecting New Portfolio. Once created, each portfolio can be customized with its own set of investments, performance metrics, and display preferences.

New Performance Metrics for Deeper Investment Analysis

To help investors make more informed decisions, EquityStat has added several new performance‑focused data columns:

Newly Added Metrics

  • Quarterly Return – Track short‑term performance trends and identify momentum.
  • P/E Ratio (Price‑to‑Earnings) – Evaluate whether a stock is undervalued or overvalued.
  • Dividend Yield – Quickly see which holdings generate income and how much.

These metrics can be enabled from the Options menu under Change Columns, allowing you to tailor your dashboard to the data that matters most to you.

Maximize Your Portfolio View for Better Visibility

Large portfolios can sometimes require scrolling or navigating between panes to see all your holdings. To solve this, EquityStat now includes a Maximize Portfolio feature that expands your investment list to fill more of your screen.

What Maximize Mode Does

  • Expands the investment section to show more rows at once
  • Moves the transaction section downward for a cleaner layout
  • Reduces the need for scrolling and window adjustments

This is especially useful for investors with extensive holdings or those working on smaller screens.

To activate it, click the three‑line menu icon in the upper‑left corner of your portfolio and select Maximize. You can return to the default pane layout anytime by choosing Restore.

Why These Updates Matter for Investors

These enhancements aren’t just cosmetic, they are designed to improve the way you interact with your financial data:

  • Faster decision‑making thanks to clearer metrics
  • More efficient navigation with customizable portfolios
  • Better organization for multi‑account investors
  • Improved user experience across devices

As the investing landscape becomes more complex, having a flexible and powerful portfolio tracker is essential. EquityStat continues to evolve its tools to support both new and experienced investors.

Have Ideas for Future Features?

EquityStat actively welcomes feedback from its users. If you have suggestions for new tools, metrics, or improvements, the team encourages you to reach out and share your ideas. User input plays a key role in shaping future updates.

Contact us and let us know.


Creating multiple portfolios – New Feature

We recently added a new feature to your EquityStat portfolio manager. You can now create multiple portfolios for your account. Having multiple portfolios gives you the ability to group and separate your investments. For example, you can have a portfolio for your individual stocks, a portfolio for your mutual funds and a portfolio for your 401K.

To add a new portfolio click the New menu and then chose the New Portfolio menuitem from the dropdown menu.

Create a New EquityStat Portfolio
How to create a new portfolio in EquityStat

You will then see two new tabs. A tab for your current portfolio and a tab for your new portfolio.

Change Portfolio Name EquityStat
How to change the portfolio name

To edit the name of your portfolio click the pencil icon, which will display an edit box.

Edit Portfolio Name
How to edit a portfolio name.

Next type over the current portfolio name with the new portfolio name and click the Save button.

View portfolio investments
View a specific portfolio

To view the investments of each portfolio click on the portfolio’s tab. From here you can also add new investments to the portfolio as well as edit investments.

To view the view the performance all your entire account (all portfolios) click the Account Value box at the top.

To delete a portfolio first delete all the investments in the portfolio. Once the portfolio is empty, click the ‘X’ icon in the portfolio tab.

Behind the Design of EquityStat’s Portfolio Manager

EquityStat’s stock portfolio tracker was built for investors by investors. As investors, we found that many portfolio managers just didn’t work the way we wanted them to. Whether the portfolio manager came from a brokerage account, a mutual fund provider, or a software company, many of them just didn’t work well. That frustration was a driving force behind building EquityStat’s portfolio manager the way we did.

Automatic Price Updates

The Problem With Manual Refreshing

One major problem with other portfolio managers is that they don’t refresh your investment prices and portfolio value automatically. To see your latest values, you have to manually refresh the page yourself, every single time you want a current number.

How EquityStat Handles It

We did not want our portfolio manager to behave this way. With EquityStat, your prices and portfolio values update automatically without you having to refresh the page. Every 15 minutes, we query the latest prices for your investments and update your portfolio accordingly. In the upper right-hand corner, we even display the last time your quotes were updated, so you always know exactly how current your data is. All of this happens automatically in the background, without you having to constantly refresh the page just to see how your investments are performing.

Background Transaction Saving

The Problem With Entering Transactions

Another common problem with other portfolio managers is entering transactions. When you enter a transaction, many portfolio managers will post it back to the web server and then do a full page refresh to show the new data. It works, but it is cumbersome, especially if you’re entering several transactions in a row.

How EquityStat Handles It

EquityStat’s portfolio manager handles this differently by doing all of the saving in the background. When you add or edit a transaction, it is saved and updated behind the scenes automatically. The only thing you’ll see is a brief notification at the top of your portfolio letting you know the transaction has been saved. The benefit is less page refreshing and a more natural, less cumbersome way of entering your investment activity, whether you are logging a single trade or updating your portfolio after a busy trading day.

Why It Matters

Small design decisions like these add up. A stock portfolio tracker that constantly needs to be refreshed, or that interrupts you every time you log a transaction, gets in the way of the thing it is supposed to help with, actually understanding how your investments are doing. Automatic price updates and background transaction saving were two of the earliest design choices we made with that in mind, and they are still core to how EquityStat works today.

If you bought Berkshire stock how rich would you be?

If you bought Berkshire Hathaway (BRK.A) stock instead of paying for college, how rich would you be?  Instead of having that fabulous wedding, what if you bought Berkshire?  How about if you owned a couple of shares of Berkshire instead of your dream home, how rich would you be?

Use our Berkshire Wealth Calculator to find out.  Just click this link

How rich would you be if you invested in Berkshire Hathaway?

and then enter the year you went to college, had that fabulous wedding or bought your dream home.  Next, enter the amount you paid.  Click Go and you will see how rich you could be.


Changing Columns in Your Portfolio

By default we display a pre-configured set of columns for your portfolio.  If you desire you can easily change the columns that are displayed in your portfolio.  To do this click the Options link at the top of your portfolio and choose the Change Columns menuitem.

Change Performance Metrics in EquityStat's Investment Portfolio Manager
Change Columns In Your Portfolio

Clicking the Change Columns menuitem will display a list of columns that are available and a list of columns your are currently using.  You can add and remove columns as well as change the order of your columns.  If you want a description of a column, just click on the column in either of the lists.

When you are finished change your columns, click the Change button to save your changes and get back to your portfolio.

Importing your transactions into EquityStat

Do you have a lot of transactions that you need to import into EquityStat that you don’t want to manually enter? If so then you can use EquityStat’s import feature to import these transactions.

To import your transactions first get these transactions into a CSV (comma separated variable) file. The easiest way to generate a CSV file is to use Excel or any other spreadsheet application. With Excel you can enter your data into a spreadsheet and then save the file as a CSV file.

The CSV file must be in a certain format for you to import your transactions into your portfolio. The first line in the file must identify what each column is. The following column indentifiers are valid – Symbol, Date, TranType, Quantity, Price, Amount, Commission.

The valid values for the TranType column are Buy, Sell, Div, Rediv (Re-invested Dividend), Longcg (Long-Term Capital Gain), Shortcg (Short-Term Capital Gain), Relongcg (Re-Invest Long Term Capital Gain), Reshortcg (Re-Invest Short Term Capital Gain).

If you have a TranType value of Div then you will need an Amount column and you will not need the Quantity and Price column. If you have a TranType value of something other than a non re-invested dividend or non re-invested capital gain, you will need a Quantity and Price column. All rows must have a Symbol and Date column.

Here is a screen shot of a sample Excel file in the proper format.

Import Transactions into EquityStat's Stock Portfolio Tracker
Import transactions into EquityStat

Once you have your data entered in your spreadsheet, save it as a CSV file.

Next, login to your portfolio and  click the New menu and choose Import Transactions.  Then from the Import page, upload your CSV file from your computer.  The transactions that will be imported will then be displayed.  If everything is correct, continue the import process.

If you have any questions with how to do an import, feel free to contact our support desk by clicking the Help link from our home page.

Does Buffett think Berkshire stock is underpriced?

If you read Berkshire’s annual letter, you can gain a lot of insight as to what Buffett thinks of Berkshire. So based on the 2014 annual letter, does Buffett think Berkshire’s stock is undervalued, overvalued or just right?

First, Buffett has always said, over time Berkshire’s stock price will reflect the intrinsic value of the business. Calculating Berkshire’s intrinsic value is not a precise exercise but a lot of analysts do it, including Buffett and Munger.

In his 2014 annual letter, Buffett points out several times that the value of an asset on the books is a lot less than the true or intrinsic value of the asset. For example, when discussing Berkshire’s insurance float he says

Charlie and I believe the true economic value of our insurance goodwill – what we would happily pay for float of similar quality were we to purchase an insurance operation possessing it – to be far in excess of its historic carrying value. Under present accounting rules (with which we agree) this excess value will never be entered on our books. But I can assure you that it’s real. That’s one reason – a huge reason – why we believe Berkshire’s intrinsic business value substantially exceeds its book value.

When discussing the businesses that make up Berkshire, Buffett says

Furthermore, the intrinsic value of these businesses, in aggregate, exceeds their carrying value by a good margin, and that premium is likely to widen. Even so, the difference between intrinsic value and carrying value in both the insurance and regulated-industry segments is far greater. It is there that the truly big winners reside.

And finally, Buffett points out that the peculiarities of Marmon’s rail car business which causes Marmon’s book value to be undervalued.

One further fact about our rail operation is important for you to know: Unlike many other lessors, we manufacture our own tank cars, about 6,000 of them in a good year. We do not book any profit when we transfer cars from our manufacturing division to our leasing division. Our fleet is consequently placed on our books at a “bargain” price. The difference between that figure and a “retail” price is only slowly reflected in our earnings
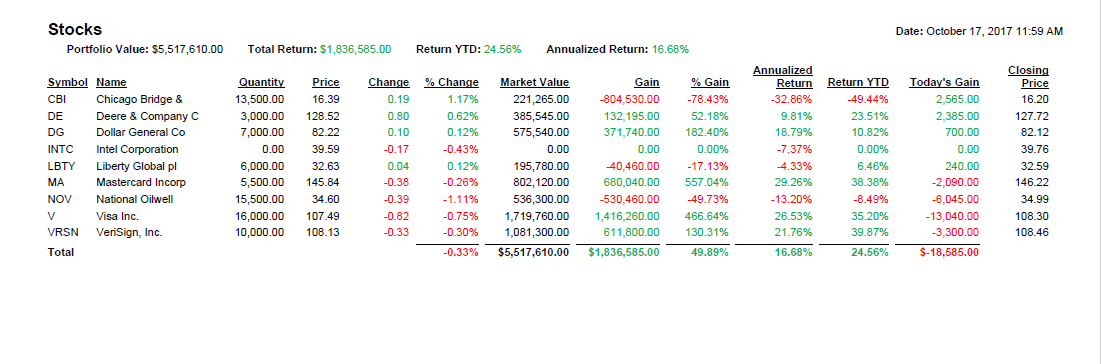
through smaller annual depreciation charges that we enjoy over the 30-year life of the car. Because of that fact as well as others, Marmon’s rail fleet is worth considerably more than the $5 billion figure at which it is carried on our books.

Based on these quotes is Buffett hinting that book value is substantially under intrinsic value? And since Buffett believes stock price will eventually be the same as intrinsic value, does Buffett believe Berkshire’s stock price is undervalued?

I think the answer is a yes!

Best Quotes from Berskhire Letter

On Saturday Warren Buffett released his annual letter on Berkshire Hathaway.  If you are an investor it is a must read.  Here are the best quotes from the letter.

On Berkshire’s Investments

… stock repurchases at Coca-Cola, American Express and Wells Fargo raised our percentage ownership of each. Our equity in Coca-Cola grew from 9.1% to 9.2%, our interest in American Express increased from 14.2% to 14.8% and our ownership of Wells Fargo grew from 9.2% to 9.4%. And, if you think tenths of a percent aren’t important, ponder this math: For the four companies in aggregate, each increase of one-tenth of a percent in our ownership raises Berkshire’s portion of their annual earnings by $50 million.

On BNSF Railroad

BNSF, like all railroads, also moves its cargo in an extraordinarily fuel-efficient and environmentally friendly way, carrying a ton of freight about 500 miles on a single gallon of diesel fuel. Trucks taking on the same job guzzle about four times as much fuel.

Elephant Hunting or Tuna Fishing?

In past letters Buffett has said he is elephant hunting for new businesses.  He is now fishing.

With the acquisition of Van Tuyl, Berkshire now owns 9 1⁄2 companies that would be listed on the Fortune500 were they independent (Heinz is the 1⁄2). That leaves 490 1⁄2 fish in the sea. Our lines are out.

Investing Wisdom

… my experience in business helps me as an investor and that my investment
experience has made me a better businessman. Each pursuit teaches lessons that are applicable to the other. And some truths can only be fully learned through experience. (In Fred Schwed’s wonderful book, Where Are the Customers’ Yachts?, a Peter Arno cartoon depicts a puzzled Adam looking at an eager Eve, while a caption says, “There are certain things that cannot be adequately explained to a virgin either by words or pictures.”
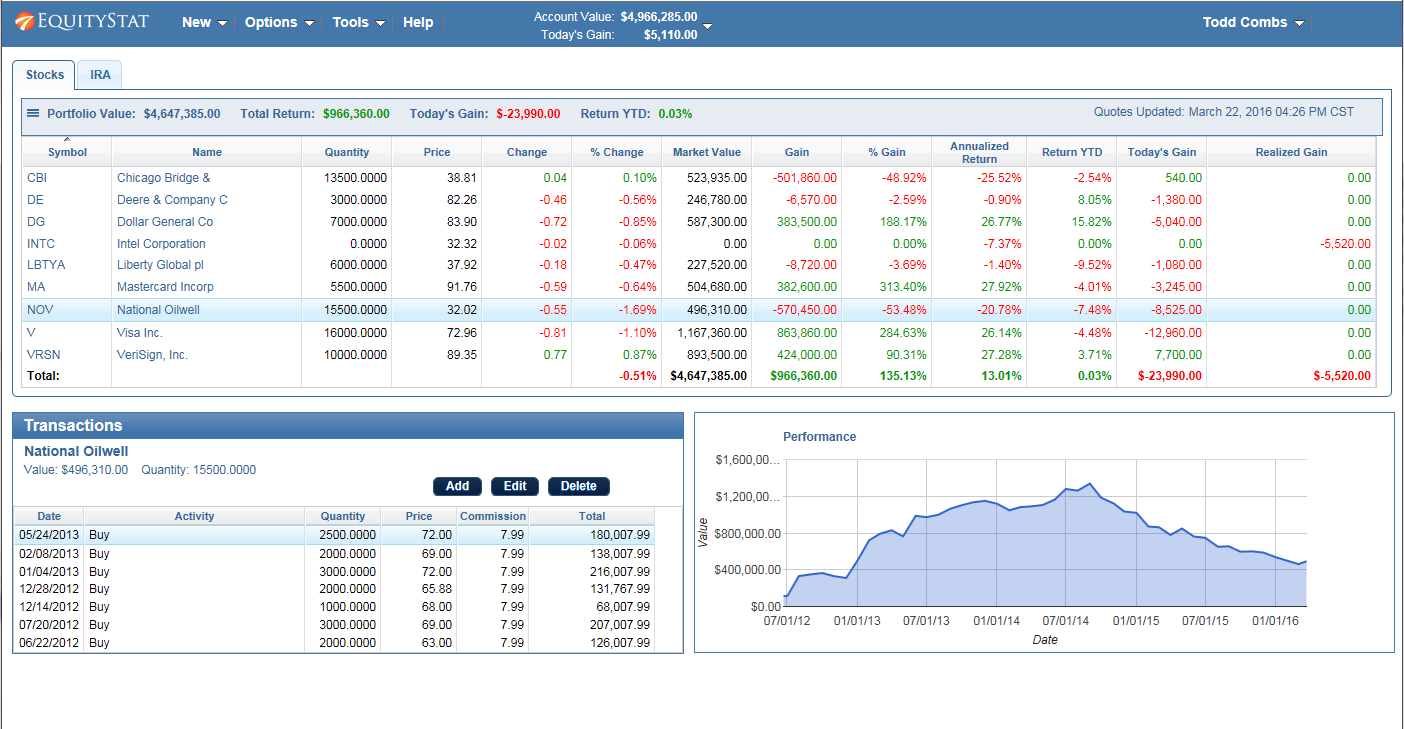
For the great majority of investors, however, who can – and should – invest with a multi-decade horizon, quotational declines are unimportant. Their focus should remain fixed on attaining significant gains in purchasing power over their investing lifetime. For them, a diversified equity portfolio, bought over time, will prove far less risky than dollar-based securities.
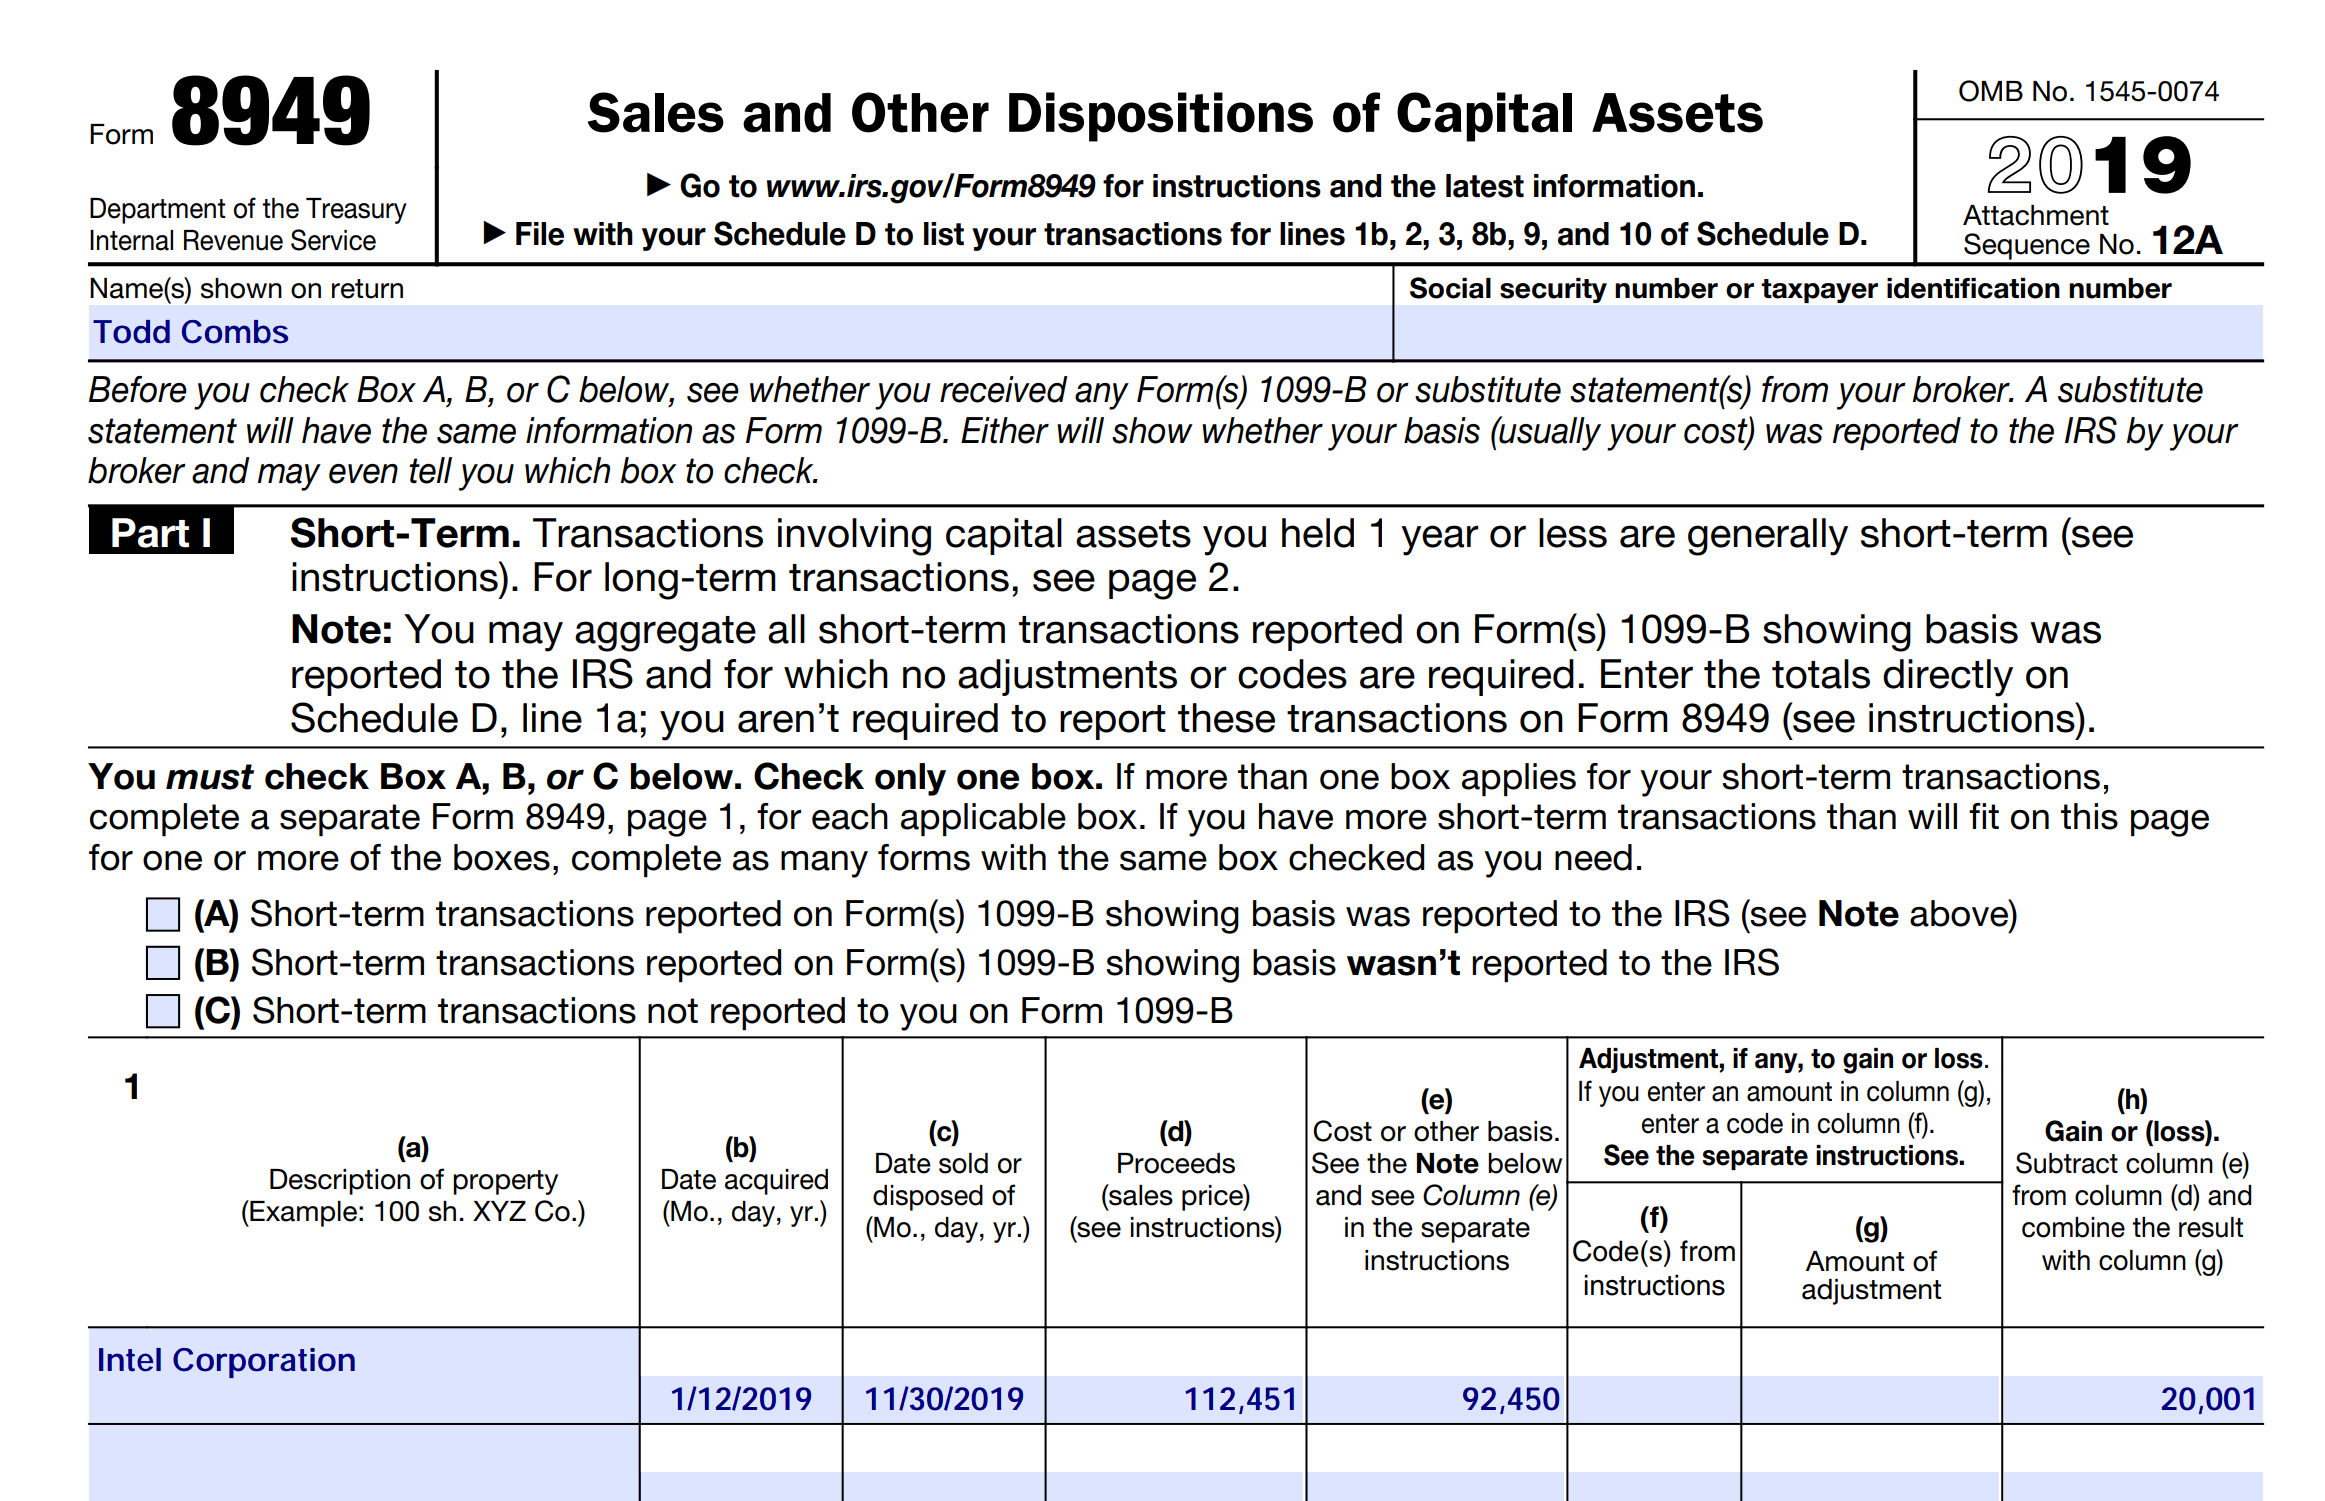
Funny

The gecko, I should add, has one particularly endearing quality – he works without pay. Unlike a human spokesperson, he never gets a swelled head from his fame nor does he have an agent to constantly remind us how valuable he is. I love the little guy.

When I was a teenager– in my one brief flirtation with honest labor – I tossed about 500,000 papers.

Benjamin Franklin Wisdom

Buffett always has some common sense wisdom in his letters.

It’s better to have a partial interest in the Hope Diamond than to own all of a rhinestone.

In the world of business, bad news often surfaces serially: You see a cockroach in your kitchen; as the days go by, you meet his relatives.

Market forecasters will fill your ear but will never fill your wallet.

We’ve found that if you advertise an interest in buying collies, a lot of people will call hoping to sell you their cocker spaniels.

… never underestimate the man who overestimates himself.

Dividend?

Buffett has always said Berkshire won’t pay a dividend but hints that they might in the future.

Eventually – probably between ten and twenty years from now – Berkshire’s earnings and capital resources will reach a level that will not allow management to intelligently reinvest all of the company’s earnings. At that time our directors will need to determine whether the best method to distribute the excess earnings is through dividends, share repurchases or both.

Cost Basis

What is Cost Basis?

Investopedia defines cost basis as:

The original value of an asset for tax purposes (usually the purchase price), adjusted for stock splits, dividends and return of capital distributions. This value is used to determine the capital gain, which is equal to the difference between the asset’s cost basis and the current market value. Also known as “tax basis”.

Why is it important?

The IRS is requiring more and more reporting of your cost basis of your investment.  They also require your report the capital gains/losses of your investments. To calculate your capital gains you need to know your cost basis.

How do you calculate it?

On the surface calculating cost basis sounds easy. Just use the price you paid for your stock. For example, if you purchased a 100 shares of XYZ company for $120 then your cost basis is $120. However, things get complicated if you had 3 for 2 stock split. Also, what if you purchase an additional 50 shares for $90? What if you have a split, reinvest capital gains and purchases in a given year? What is your cost basis? Now things get really complicated.

How EquityStat makes things easier

With EquityStat all you have to do is enter your purchases, splits, capital gains and we will calculate your cost basis. Then when you sell your stock whether all of your shares or just some of your shares, we can easily calculate your gain or loss. You can then generate IRS Form 8949 that will show your cost for each investment you sold in the last year.

TurboTax and Investment Taxes

Do you use TurboTax to calculate your investment gains and losses?  Do you use TurboTax to generate form Schedule D or Form 8949?  If so be aware that TurboTax is now charging extra for these features.

In addition to paying $59.99 for the Deluxe version of Turbo tax, if you want to calculate your investment capital gains or losses from stock, mutual fund or ETF sales you will have to pay an additional $20 or $30.

You can read more about the changes to TurboTax here.

http://www.latimes.com/business/hiltzik/la-fi-mh-intuits-catastrophic-turbotax-20150118-column.html

If you are looking for an alternative to TurboTax for calculating your capital gains or losses, checkout EquityStat.  With EquityStat you can generate IRS Form 8949 .  Form 8949 is used to report your short and long term capital gains and loses.  Once you enter your purchases and sales of your investments into EquityStat, you can then generate Form 8949 and use this form to fill out your Schedule D Form.

Investments, Taxes, Form 8949, Schedule D

Selling Investments and the IRS

The IRS is requiring more reporting when you sell your investments.  Specifically, they require you to report the investment cost, cost basis in investment terminology, and the gain/loss from the investment sale.  If you purchase 100 shares of a stock and sell 100 shares of the stock, your cost basis is easy to calculate.  Things get more difficult when you purchase shares in different lots.  For example, you purchase 100 shares in 2011, 50 shares in 2012, 200 shares in 2013 and sell 160 shares in 2014.

Form 8949

What is your cost basis in the above scenario?  This is not an easy calculation to do.  To make things even more difficult, you have to report both your short term gains and long term gains to the IRS separately.  Fortunately, EquityStat makes this easy.  EquityStat calculates your cost basis for each investment and can also generate IRS Form 8949 which is a report that shows your gain/loss on each investment sold.  Your tax preparer can then use Form 8949 to create the IRS Schedule D form.

To Generate Form 8949, click the Tools menu at the top of the portfolio and then click the Generate IRS Form 8949. Choose your tax year and EquityStat will generate the report showing both your short term and long term gain/loss on each investment you sold during the tax year.


How did your investments do in 2014?

According to the Wall Street Journal the best stock of 2014 was Southwest Airlines (LUV).  It was up 123%.  The worst stock of 2014 was Transocean (RIG).  It was down 62%.

You can see the list of best stocks here:

http://blogs.wsj.com/briefly/2014/12/31/5-best-stocks-of-2014/

You can see the list of worst stocks here:

http://blogs.wsj.com/briefly/2014/12/31/5-worst-stocks-of-2014/

How did your investments do in 2014?  What was your best stock?  What was your worst?

If you are not tracking your investment’s performance, consider using EquityStat.  With EquityStat you can track the overall performance of your portfolio as well as the performance of each individual investment.  EquityStat tracks the annualized return, daily gain, overall gain and many other metrics of your investments.  With these metrics you can easily determine what are your best investments and what are your worst investments.

Why Mutual Fund Investors Need a Portfolio Tracker

If you own mutual funds, you might wonder why you would need a separate portfolio tracker at all. Does your mutual fund not already show you everything, your transaction history, your performance, your return for the year? In practice, the tools most funds provide leave real gaps, and those gaps can cost you at tax time and give you a distorted picture of how your investment is actually doing.

The Problem With Your Mutual Fund’s Transaction History

Many mutual funds do not keep your full transaction history available to you. Some only show up to three years back, so if you have owned a fund longer than that, a chunk of your own buying and selling history is simply out of reach.

That missing history matters for two reasons. First, if you sell shares in a mutual fund, you need a complete record of your purchases to report your gain or loss to the IRS accurately. A partial history can lead to a partial, and potentially wrong, tax report. Second, a full history lets you track how your investment has actually performed over the entire time you have owned it, not just the last few years the fund happens to display.

The Problem With Your Mutual Fund’s Reported Return

Mutual funds typically report a single yearly return figure, but that figure is not necessarily your return. It reflects the change in the fund’s share price from the start of the year to the end, regardless of when you personally bought in.

Here is a simple example. Say a hypothetical mutual fund, ticker XRXRXR, trades at 100 dollars a share on January 1 and closes the year at 110 dollars a share. The fund reports a 10 percent gain for the year. Now say you actually bought your shares on July 1 at 90 dollars a share. Based on that closing price of 110 dollars, your real gain is closer to 22 percent, not 10. Or say you bought in later at 120 dollars a share. Based on that same 110 dollar closing price, you are actually down about 8 percent, even though the fund itself reported a 10 percent gain for the year. Relying on the fund’s headline number alone can leave you thinking you did better, or worse, than you really did.

How a Portfolio Tracker Solves Both Problems

A dedicated portfolio tracker like EquityStat keeps your complete transaction history for as long as you use it, with no three year cutoff. That full record means you always have what you need to report gains or losses accurately, and EquityStat can generate IRS Form 8949 directly from that same transaction data when it comes time to calculate the gain or loss on any mutual fund shares you sell.

EquityStat also calculates your annualized return based on the actual dates you purchased and sold your shares, not on the fund’s own start of year to end of year snapshot. That means the return you see reflects what you personally earned, not just what the fund’s share price happened to do over the calendar year.

Microsoft’s Portfolio Manager Discontinued — Best Alternative for MSN Money Users

Microsoft Has Shut Down Its MSN Money Portfolio Manager

Microsoft has officially discontinued the MSN Money investment portfolio manager, a tool that was once one of the most popular ways for investors to track stocks, ETFs, and mutual funds. If you previously relied on Microsoft’s portfolio tracker, you now need a modern, browser‑friendly alternative. EquityStat offers a powerful replacement with similar features and far better compatibility.

Why Microsoft’s Portfolio Manager Stopped Working

Microsoft’s portfolio manager was built using Silverlight, a browser plugin that is no longer supported by most modern web browsers. Here’s what that means for investors:

  • Safari does not support Silverlight, so the tool cannot run on iMacs or iPads
  • Most modern browsers have removed plugin support entirely
  • The portfolio manager no longer functions on Apple devices or many Windows systems

As a result, former MSN Money users can no longer access or update their portfolios.

EquityStat: A Modern Alternative to Microsoft’s Portfolio Manager

EquityStat is built using HTML, not Silverlight, meaning it works on virtually any device with a modern web browser.

Works on All Major Platforms

You can use EquityStat on:

  • Windows PCs and tablets
  • Apple iMac and MacBook
  • iPad and iPhone
  • Android tablets and phones
  • Any device with a standard web browser

No plugins. No compatibility issues. No outdated technology.

Features Similar to MSN Money’s Portfolio Manager

EquityStat includes many of the same capabilities that made Microsoft’s tool popular:

  • Track stocks, ETFs, and mutual funds
  • View daily gain/loss
  • Monitor total return and annualized return
  • Review complete transaction history
  • Organize investments into multiple portfolios
  • Analyze performance with charts and holdings reports

If you liked MSN Money’s portfolio manager, you’ll feel right at home with EquityStat.

Key Differences That Make EquityStat Better

While EquityStat offers familiar features, it also improves on Microsoft’s discontinued tool:

  • Modern, plugin‑free design
  • Cross‑platform compatibility
  • Faster performance calculations
  • Cleaner, more intuitive interface
  • Ongoing updates and support

It’s everything the old MSN Money portfolio manager offered without the limitations.

Looking for a Replacement? Try EquityStat

If you were a previous user of Microsoft’s portfolio manager and need a reliable, modern alternative, EquityStat is one of the best options available. It’s simple, accurate, and works on every major device.

Microsoft Retires MSN Money Portfolio Manager: What Investors Can Use Instead

Microsoft has officially discontinued the MSN Money Portfolio Manager, leaving many long‑time users searching for a dependable replacement. For years, the MSN Money tool was a popular way to track investments online, but changes in browser technology eventually made it impossible for Microsoft to continue supporting it.

Why the MSN Money Portfolio Manager Was Discontinued

The original MSN Money portfolio manager was built using Silverlight, a browser plugin that worked primarily with Internet Explorer. As major browsers phased out plugin support, Silverlight‑based applications stopped functioning.

This created several issues for investors:

  • Safari users on iMac and iPad could no longer access the tool
  • Chrome and Firefox removed plugin support
  • Mobile devices became incompatible
  • Microsoft eventually retired the service entirely

With Silverlight no longer supported, the portfolio manager could not operate on modern browsers or devices.

A Modern Replacement: EquityStat’s Online Portfolio Manager

EquityStat offers a fully web‑based portfolio manager built with HTML, not plugins. This means it works on virtually any device or browser, including:

  • Windows desktops and laptops
  • Apple iMac and iPad
  • Android phones and tablets
  • Chrome, Safari, Firefox, and Edge

Because it’s built on modern web standards, EquityStat provides a smooth, reliable experience without requiring downloads or extensions.

How EquityStat Compares to the Old MSN Money Tool

Investors who previously relied on MSN Money will find that EquityStat offers many of the same core features, including:

  • Portfolio tracking
  • Performance reporting
  • Real‑time market updates
  • Easy import and export options

In addition, EquityStat includes enhancements that weren’t available in the original Microsoft tool, making it a practical upgrade for users who want a familiar but more capable portfolio manager.

Looking for an Alternative to Microsoft’s Portfolio Manager?

If you used the MSN Money portfolio manager and need a modern replacement that works across all devices, EquityStat is a strong option. It delivers the functionality investors expect, without the compatibility issues that led to the retirement of Microsoft’s tool.

Microsoft Investment Portfolio Manager Discontinued — Best Alternative for Former MSN Money Users

Microsoft has officially discontinued the MSN Money Investment Portfolio Manager, leaving many long‑time users searching for a reliable replacement. The original MSN Money tool was once considered one of the best free portfolio managers available, but with its retirement, investors now need a modern solution that works across all browsers and devices.

If you previously relied on Microsoft’s portfolio manager, EquityStat offers a powerful, easy‑to‑use alternative with many of the same features plus several important upgrades.

Why Microsoft’s Investment Portfolio Manager Was Discontinued

Microsoft’s portfolio manager was built on outdated technology that modern browsers no longer support. As a result:

  • Users could no longer access their portfolios
  • Data became difficult or impossible to retrieve
  • Microsoft retired the tool entirely

This left many investors without a way to track their holdings or view their historical performance.

A Modern Replacement: EquityStat’s Portfolio Manager

EquityStat provides a clean, browser‑based portfolio manager designed to be simple, fast, and accessible from any device. It includes many of the same features users loved in the MSN Money tool along with several enhancements that make portfolio tracking easier and more intuitive.

Key Features in EquityStat You Won’t Find in Microsoft’s Old Portfolio Manager

1. Instant View of Portfolio Performance

At login, you immediately see:

  • Total portfolio value
  • Total return
  • Daily gain

No extra clicks. No searching through menus.

2. Detailed Performance Calculations

For each investment, EquityStat displays:

  • Current market value
  • Total gain
  • Daily gain
  • Annualized return
  • Additional performance metrics

This gives investors a clear, accurate picture of how each position is performing.

3. Easy Transaction Management

All transactions for each investment are grouped together, allowing you to:

  • View
  • Add
  • Edit
  • Delete

…with just a few clicks.

4. Hide or Show Sold Investments

Toggle between:

  • A historical view of your full portfolio
  • A clean view of only your currently held investments

This makes portfolio analysis much easier.

5. Customizable Columns

You can add or remove data columns, such as:

  • 52‑week high
  • 52‑week low
  • Additional performance metrics

This lets you tailor the portfolio view to your needs.

6. Less Scrolling, More Data

EquityStat automatically adjusts to your screen size, reducing unnecessary scrolling and making better use of available space.

7. Import From Spreadsheet or CSV

If your investment history is stored in a spreadsheet, you can import it directly, no manual re‑entry required.

8. Generate Tax Forms

For sold investments, EquityStat can generate IRS Form 8949, which tax preparers use to calculate capital gains.

9. Export Your Data Anytime

Unlike Microsoft’s discontinued tool, EquityStat lets you export your transactions to a spreadsheet for permanent backup and safekeeping.

10. Works on Any Device

Because EquityStat is built using HTML, not proprietary technology, it works on:

  • Windows
  • macOS
  • iPad
  • Android
  • Any modern web browser

No plugins. No compatibility issues.

11. Simple, Focused, and User‑Driven

EquityStat is designed with a single purpose: Provide a powerful, easy‑to‑use portfolio manager without distractions or unnecessary features.

Looking for a Replacement for Microsoft’s Portfolio Manager?

If you were a user of the discontinued MSN Money portfolio manager, EquityStat offers a modern, reliable, and intuitive alternative with all the essential features and more.

$72 million High School Stock Investor Hoax

This week New York magazine reported that a New York high school student made $72 million investing in the stock market.

For a 17 year old to make $72 million from a $1000 investment, many experts calculated he would have to have returns in excess of 500% for 7 straight years. That means he would have to double his money every one to two months for 7 years straight. Yahoo Finance analyzes these returns in the article below.

http://finance.yahoo.com/news/a-high-school-senior-did-not-make–72-million–jeff-make-164536104.html

How is your investment portfolio performing? Do you know what your annualized return is? Do you have your investments scattered among brokerages and mutual funds and are unable to view your entire portfolio at once?

Check out EquityStat’s portfolio manager and get up to the minute analysis of your entire investment portfolio’s performance.

MSN Money Portfolio Manager Discontinued — Here’s the Best Alternative for Former Users

Microsoft retired the MSN Money portfolio manager, leaving many users unable to access their previously entered investment data. Because the tool is no longer supported, investors needed a new way to track:

  • Portfolio value
  • Daily gain/loss
  • Long‑term performance
  • Individual investment returns

This sudden loss of access has pushed many users to look for a more dependable, browser‑friendly solution.

A Better Alternative: EquityStat’s Online Portfolio Manager

EquityStat offers many of the same features that MSN Money users relied on — plus several improvements designed for modern investors.

Key benefits include:

1. Complete Portfolio Overview

See your entire portfolio’s:

  • Total value
  • Current gain/loss
  • Daily performance

All displayed clearly on your dashboard.

2. Detailed Investment Calculations

For each stock, mutual fund, or ETF, EquityStat shows:

  • Today’s gain/loss
  • Percentage gain since purchase
  • Realized gains
  • Annualized return
  • Additional performance metrics

This gives you a deeper understanding of how each investment is performing.

3. Full Transaction History

EquityStat displays all transactions for each investment, allowing you to:

  • Add
  • Edit
  • Delete

…any entry with ease.

You can enter transactions manually or import them from a spreadsheet.

4. Permanent Data Control

One of the biggest frustrations with MSN Money’s shutdown is that many users lost access to their data.

EquityStat prevents this problem by allowing you to:

  • Export each investment’s transactions
  • Save them as a spreadsheet
  • Maintain a permanent backup

Your data stays in your control — always.

5. Simple, Reliable, and Easy to Use

EquityStat focuses on delivering a clean, intuitive portfolio manager without unnecessary complexity. It’s designed for investors who want accurate tracking, clear reporting, and dependable access to their information.

Miss MSN Money’s Portfolio Manager? Try EquityStat

If you were disappointed to see Microsoft retire its portfolio manager, EquityStat offers a strong, modern replacement with the features you need to track your investments confidently.