Why You Can’t See Your Real Investment Performance From Any Single Brokerage App

Open your brokerage app right now and it will tell you exactly how that account is doing. What it won’t tell you is how you’re doing. If you also have a 401(k) with a former employer, an IRA at a different provider, or a handful of mutual funds bought years ago, your brokerage app has no idea any of that exists. It’s not being unhelpful, it simply can’t see outside its own walls. That’s the core problem with trying to understand your investment performance one account at a time, and it’s the reason a dedicated stock portfolio tracker exists in the first place.

Every Brokerage App Has the Same Blind Spot

Brokerage apps are built to serve one purpose, help you manage the money that is inside that specific brokerage. Fidelity’s app knows about your Fidelity account. Schwab’s app knows about your Schwab account. Neither one has any visibility into the other, and neither has any reason to build that visibility, since it isn’t their job to help you understand your finances outside their platform.

That means every number you see in a brokerage app, your return, your gain, your dividend income, is only ever a partial answer. If you’re checking three or four different apps to get a sense of where you stand, you’re not actually looking at your investment performance. You’re looking at fragments of it, and doing the aggregation yourself, in your head, imperfectly.

What You Actually Can’t See Without Aggregating

A few specific numbers are simply impossible to calculate from any single account:

  • Total return across everything you own. A single brokerage can tell you its own return, but not your blended return once a 401(k), an IRA, and a taxable brokerage account are all factored in together.
  • Combined dividend income. If you own dividend-paying stocks in more than one account, no single provider can show you your total dividend income for the year. Only a dedicated stock dividend tracker that pulls every account together can do that.
  • True asset allocation. Your brokerage app might show you’re well-diversified within that account, while you’re unknowingly overexposed to a single sector once your 401(k) holdings are counted too.
  • Overall net worth. Net worth isn’t a brokerage feature, it’s an aggregation problem. It only exists once every account, brokerage, retirement, and otherwise, is added together.
  • Which of your accounts is actually performing best. Without a side-by-side comparison, there’s no way to know whether your IRA, your brokerage account, or your old 401(k) is doing the heavy lifting, or dragging down your results.

None of these are edge cases. They’re the basic questions any investor eventually wants answered, and none of them can be answered by a tool that only sees one piece of the puzzle.

Why a Spreadsheet Doesn’t Really Solve It Either

The obvious workaround is to build a spreadsheet in Excel or Google Sheets and update it yourself. In practice, this breaks down quickly. Prices need to be looked up and re-entered by hand. Returns have to be recalculated with every trade. Dividends have to be logged manually as they arrive. It is not that a spreadsheet in Excel or Google Sheets cannot hold the data, it is that keeping it accurate becomes a part-time job.

A proper stock portfolio tracker application solves the maintenance problem specifically. It pulls current prices automatically and recalculates your returns as soon as you log a transaction, so the aggregated view stays accurate without you having to rebuild it every time something changes, the way you would need to in an Excel or Google Sheets file. You still enter your own trades and holdings, the same way you would in a spreadsheet, but the tracker takes over everything else, the pricing, the math, and the performance calculations.

What a Real Stock Portfolio Manager Should Show You

A tool built specifically to solve this problem, rather than a brokerage app that happens to show you a balance, should be able to answer the questions your individual accounts can’t:

  • Consolidated performance metrics. Gain, quarterly return, year-to-date return, and annualized return, calculated across your full portfolio, not just one account at a time.
  • Benchmark comparisons. The ability to see whether your overall strategy is beating, matching, or underperforming the S&P 500, Dow Jones, or Nasdaq, something no single brokerage account can tell you in isolation.
  • Dividend tracking at every level. Dividend income visible per investment, per portfolio, and across your entire account, so you always know your true income from holdings, not just the ones in one place.
  • Historical view. The ability to see what your full portfolio looked like on a past date, useful for reviewing performance over time or preparing for tax season.
  • Tax reporting that spans everything you sold. When it’s time to file, a consolidated tracker can generate IRS Form 8949 covering every sale across every account, calculating your long-term and short-term gains and losses so you can hand the report straight to your accountant.

This is the same reasoning EquityStat was built around from the start, investors who were managing their own money got tired of tools that could only see one slice of it, and built something that could see all of it instead.

The Real Cost of Not Aggregating

The risk of checking accounts separately isn’t just inconvenience, it’s blind spots that compound over time. An investor might feel diversified because each individual account looks reasonable, while their combined holdings are quietly concentrated in one sector or a handful of overlapping funds. Or they might underestimate how much they’re actually earning in dividends because it’s split across three accounts and never added up. Or they simply won’t know, in any given year, whether their overall strategy is working, because “overall” was never actually calculated.

None of these are dramatic failures. They’re just the slow cost of never having the full picture, and they’re avoidable the moment every account gets pulled into one place.

Frequently Asked Questions

Why can’t my brokerage app show me my total portfolio performance? Because it only has visibility into the account it manages. It has no data about your other brokerage accounts, your 401(k), or your IRA, so it can only ever report on its own slice of your investments.

Is a spreadsheet in Excel or Google Sheets a good enough substitute for a portfolio tracker? A spreadsheet in Excel or Google Sheets can hold the data, but keeping prices, returns, and dividends current requires ongoing manual work. A dedicated stock portfolio tracker automates the pricing and performance calculations, so the aggregated view stays accurate without constant upkeep.

What accounts should I include when tracking my investment performance? Every account that holds investments, brokerage accounts, 401(k)s, IRAs, and mutual funds, should be included. Leaving any of them out means your total return, dividend income, and asset allocation numbers will all be incomplete.

Can I see my net worth using a stock portfolio tracker? Yes, as long as the tracker supports multiple account types. Net worth is fundamentally an aggregation calculation, so it depends on having every account represented in one place rather than checked separately.
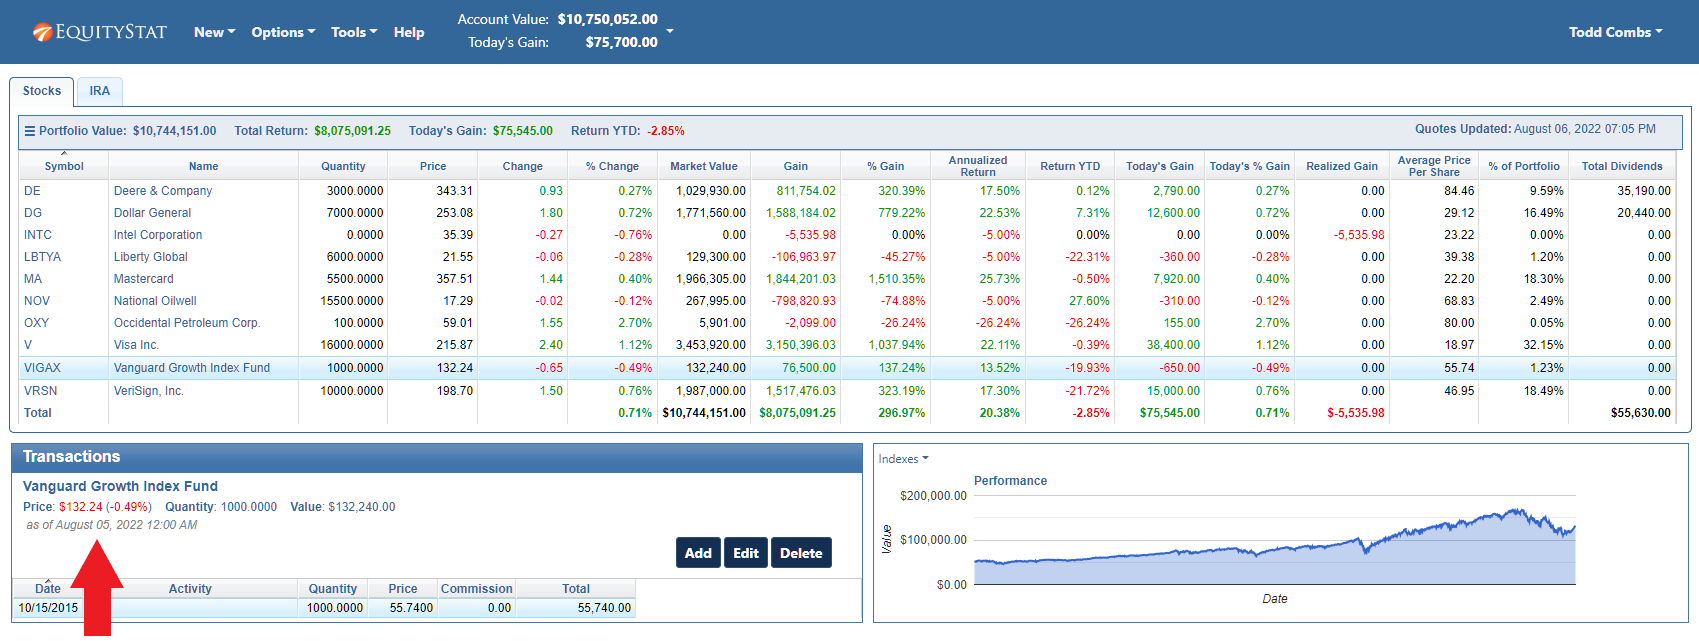
Mutual Fund Investments Now Show the Last Update Date

Mutual fund prices now show the exact date they were last updated, right in your transaction panel. We added a date stamp directly next to the price, so it is easy to tell how current the price is.

Why Mutual Funds Only Update Once a Day

Unlike stocks and ETFs, mutual funds do not trade throughout the day. Their price, known as the net asset value, is calculated once the market closes and is not posted until sometime after that. Because of this timing, it has always been hard to tell whether the price you are looking at reflects the current day or the day before, especially if you check your portfolio in the morning before the new price has come through. Now, next to every mutual fund price, you will see the exact date that price was posted. One glance tells you whether you are looking at a fresh number or one that is a day old.

EquityStat Mutual Fund Price Date

More Transaction Panel Changes

Percent Change Now Shown In the Transaction Panel

Another user interface change to the transaction panel is that we are now showing the percent change in the transaction panel for every investment, alongside the dollar figure.

Quick Access to Financial Details from the Transaction Panel

We also made it easier to see financial detail on any holding without leaving your portfolio. Click the name of any investment in the transaction panel and you will be taken straight to its page on MSN Money, where you can dig into news, charts, and additional details.

A Faster, Clearer Portfolio Review

Together, these changes are meant to make your daily portfolio review faster and clearer. You should never have to wonder if a number is stale or squint to figure out which holdings moved. With the updated date stamps and color coded percent changes, that information is right there in front of you.

If you track mutual funds, stocks, ETFs, or a mix of everything, log in and take a look at your transaction panel to see the changes for yourself.

Ditch the Stock Spreadsheet: A Better Way to Track Your Stock Portfolio

Plenty of investors keep their stock portfolio in a spreadsheet, usually in Excel or Google Sheets. It is a familiar tool, it lets you calculate a few performance numbers on your own, and it gives you a quick way to check your net worth without logging into every brokerage site you own an account with. It also feels private, since the file lives on your own computer and nobody else can open it.

That familiarity comes at a real cost, though. Once you look closely at what an Excel or Google Sheets spreadsheet cannot do, the drawbacks start to add up.

The Problem With Keeping Your Prices Current

A stock spreadsheet in Excel or Google Sheets is only as accurate as its most recent price update, and updating it is on you. Enter prices by hand every day and it becomes a small chore that eats a few minutes you probably would rather spend somewhere else. Try to automate it with a stock data service instead, and now you are relying on a formula or add in that can break the moment that service changes its interface or goes down for a day. Either way, you are the one responsible for keeping the numbers honest.

The Problem With Being Tied to One Computer

A spreadsheet also only exists in one place. If your Excel file lives on your home computer, you cannot pull it up at work. If you use a laptop, a desktop, and a tablet at home, the file usually lives on just one of them, and you are stuck checking your portfolio only when you happen to be sitting in front of that particular machine. Google Sheets solves some of this since it lives online, but you are still stuck rebuilding the same manual formulas and price lookups no matter which device you open it from.

A Better Way to Track Your Portfolio

EquityStat was built to solve exactly these problems. Your portfolio’s value updates on its own, since EquityStat handles pulling in near real time prices for you, so there is no more typing numbers into cells every morning and no formula to babysit the way you would in Excel or Google Sheets.

Because EquityStat lives in the cloud rather than on one hard drive or inside one Google account, you can pull up your portfolio from any computer or device with a web browser, at home, at work, on a Windows machine, a Mac, or an iPad, any time of day. You are never stuck waiting to get back to one specific desk just to check how your investments are doing.

As for the privacy concern that makes a spreadsheet feel safe, EquityStat does not ask for your brokerage passwords the way some other portfolio tools do. You enter your holdings and transactions yourself, so your login credentials for your actual brokerage accounts never leave your hands.

What You Get Beyond a Spreadsheet

Along with automatic pricing and access from anywhere, EquityStat calculates the performance metrics that are genuinely tedious to build correctly in an Excel or Google Sheets spreadsheet on your own, including annualized return, year to date return, quarterly return, and average price per share. These are the same numbers serious investors want to track, without the manual formula work.

Why Mutual Fund Investors Need a Portfolio Tracker

If you own mutual funds, you might wonder why you would need a separate portfolio tracker at all. Does your mutual fund not already show you everything, your transaction history, your performance, your return for the year? In practice, the tools most funds provide leave real gaps, and those gaps can cost you at tax time and give you a distorted picture of how your investment is actually doing.

The Problem With Your Mutual Fund’s Transaction History

Many mutual funds do not keep your full transaction history available to you. Some only show up to three years back, so if you have owned a fund longer than that, a chunk of your own buying and selling history is simply out of reach.

That missing history matters for two reasons. First, if you sell shares in a mutual fund, you need a complete record of your purchases to report your gain or loss to the IRS accurately. A partial history can lead to a partial, and potentially wrong, tax report. Second, a full history lets you track how your investment has actually performed over the entire time you have owned it, not just the last few years the fund happens to display.

The Problem With Your Mutual Fund’s Reported Return

Mutual funds typically report a single yearly return figure, but that figure is not necessarily your return. It reflects the change in the fund’s share price from the start of the year to the end, regardless of when you personally bought in.

Here is a simple example. Say a hypothetical mutual fund, ticker XRXRXR, trades at 100 dollars a share on January 1 and closes the year at 110 dollars a share. The fund reports a 10 percent gain for the year. Now say you actually bought your shares on July 1 at 90 dollars a share. Based on that closing price of 110 dollars, your real gain is closer to 22 percent, not 10. Or say you bought in later at 120 dollars a share. Based on that same 110 dollar closing price, you are actually down about 8 percent, even though the fund itself reported a 10 percent gain for the year. Relying on the fund’s headline number alone can leave you thinking you did better, or worse, than you really did.

How a Portfolio Tracker Solves Both Problems

A dedicated portfolio tracker like EquityStat keeps your complete transaction history for as long as you use it, with no three year cutoff. That full record means you always have what you need to report gains or losses accurately, and EquityStat can generate IRS Form 8949 directly from that same transaction data when it comes time to calculate the gain or loss on any mutual fund shares you sell.

EquityStat also calculates your annualized return based on the actual dates you purchased and sold your shares, not on the fund’s own start of year to end of year snapshot. That means the return you see reflects what you personally earned, not just what the fund’s share price happened to do over the calendar year.