Most investors don’t have one account. They have a brokerage account, maybe a 401(k) from work, an IRA, a handful of mutual funds picked up over the years. Each one lives on a different platform, with a different login, showing a different slice of the picture, and none of them show the whole thing. EquityStat exists to answer a simple question: what if you could see all of it in one place?
Who is EquityStat?
EquityStat is a stock portfolio tracker built by investors, for investors. It wasn’t designed by a bank or a brokerage trying to keep you inside their ecosystem, but was built instead by people who were managing their own investments and got tired of the tools available to them. That distinction matters. A stock portfolio manager built by someone with a brokerage relationship to protect has a reason to keep your data siloed. A stock portfolio tracker application built by investors, for investors, doesn’t, since its only job is to give you an accurate, complete view of what you own.
That independence is also why EquityStat doesn’t ask for your brokerage passwords or sell your information. You enter your own holdings and transactions, and the platform’s only incentive is to represent them accurately. It’s a meaningfully different relationship than tools built around monetizing your financial data.
EquityStat’s reputation has grown the same way most trustworthy financial tools do: one investor at a time, through word of mouth and results. Customers describe it as more complete than their brokerage’s own software, better than other trackers they’d tried, and easier to log into than jumping through their broker’s site. That kind of comparative praise, from people who tried alternatives first, carries real weight. It’s also drawn outside recognition: Kiplinger’s Personal Finance featured EquityStat in a 2024 roundup of tools for do-it-yourself stock investors, specifically as a pick for portfolio tracking. You can read the full Kiplinger Magazine names EquityStat a top stock portfolio manager.
What is EquityStat?
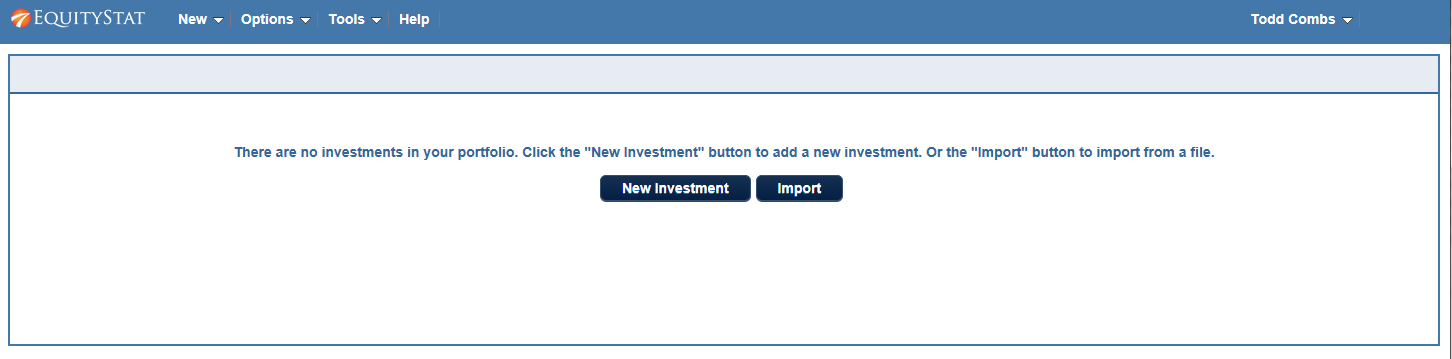
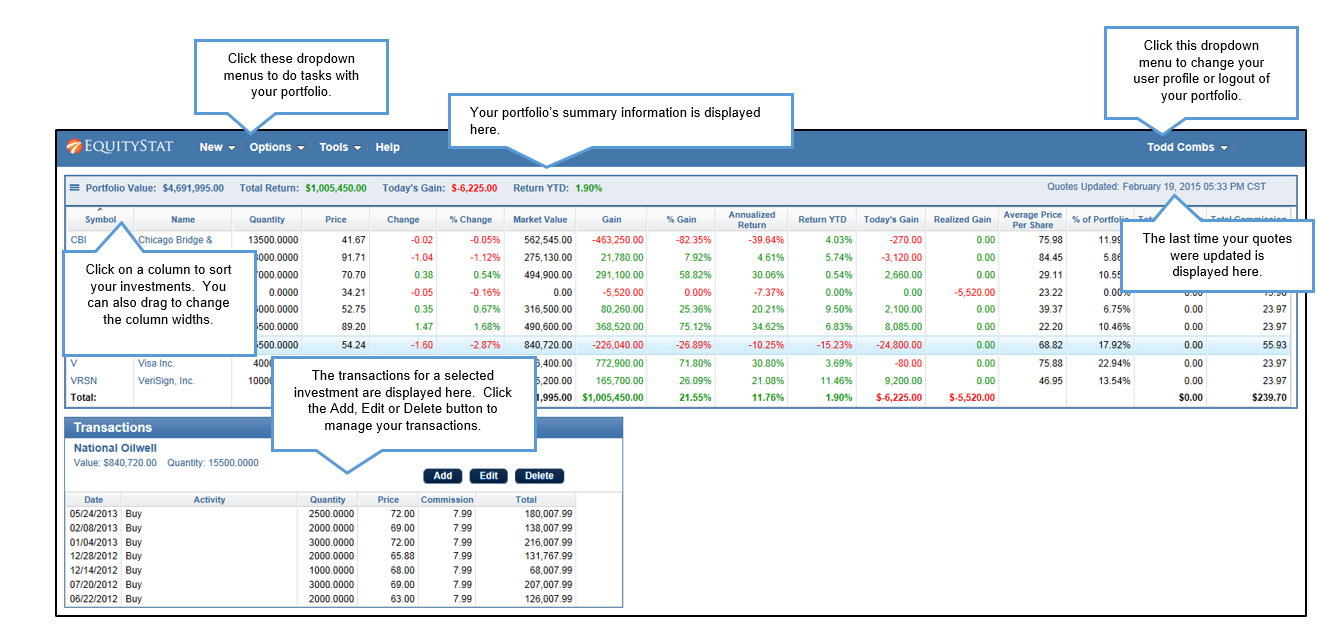
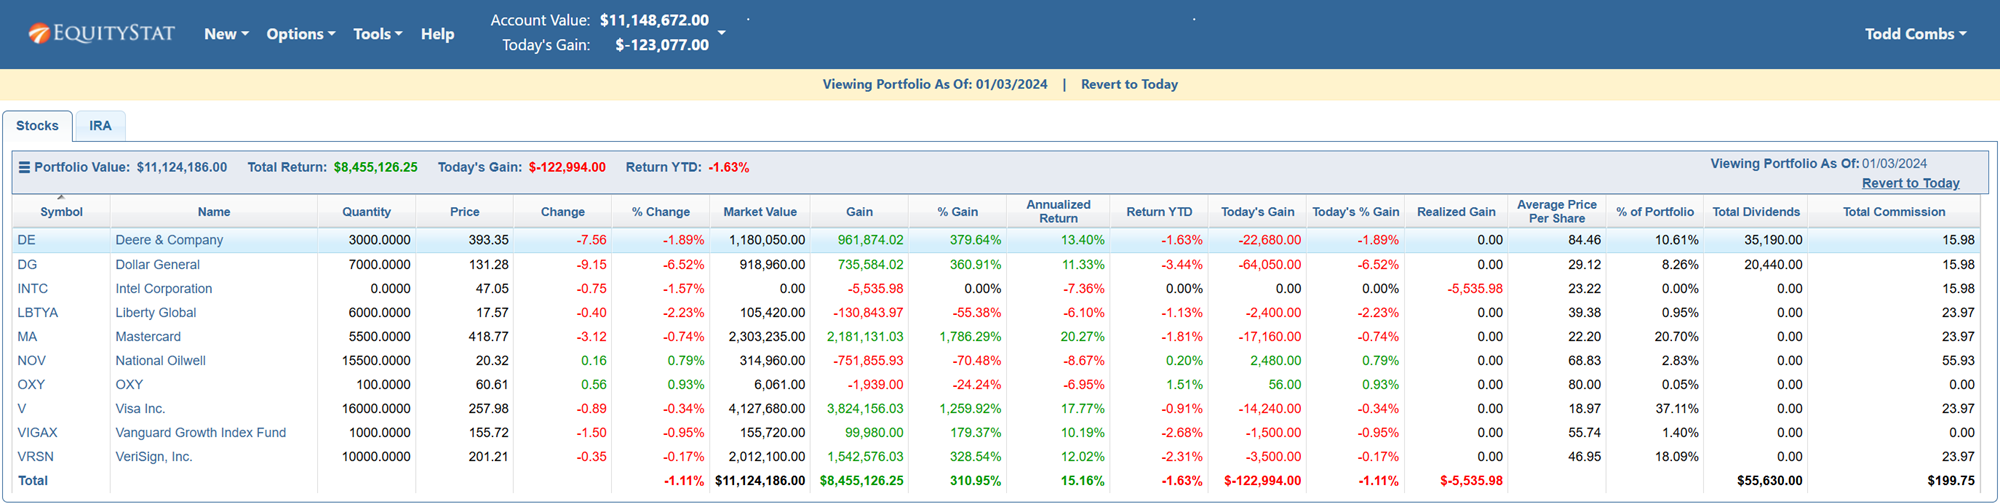
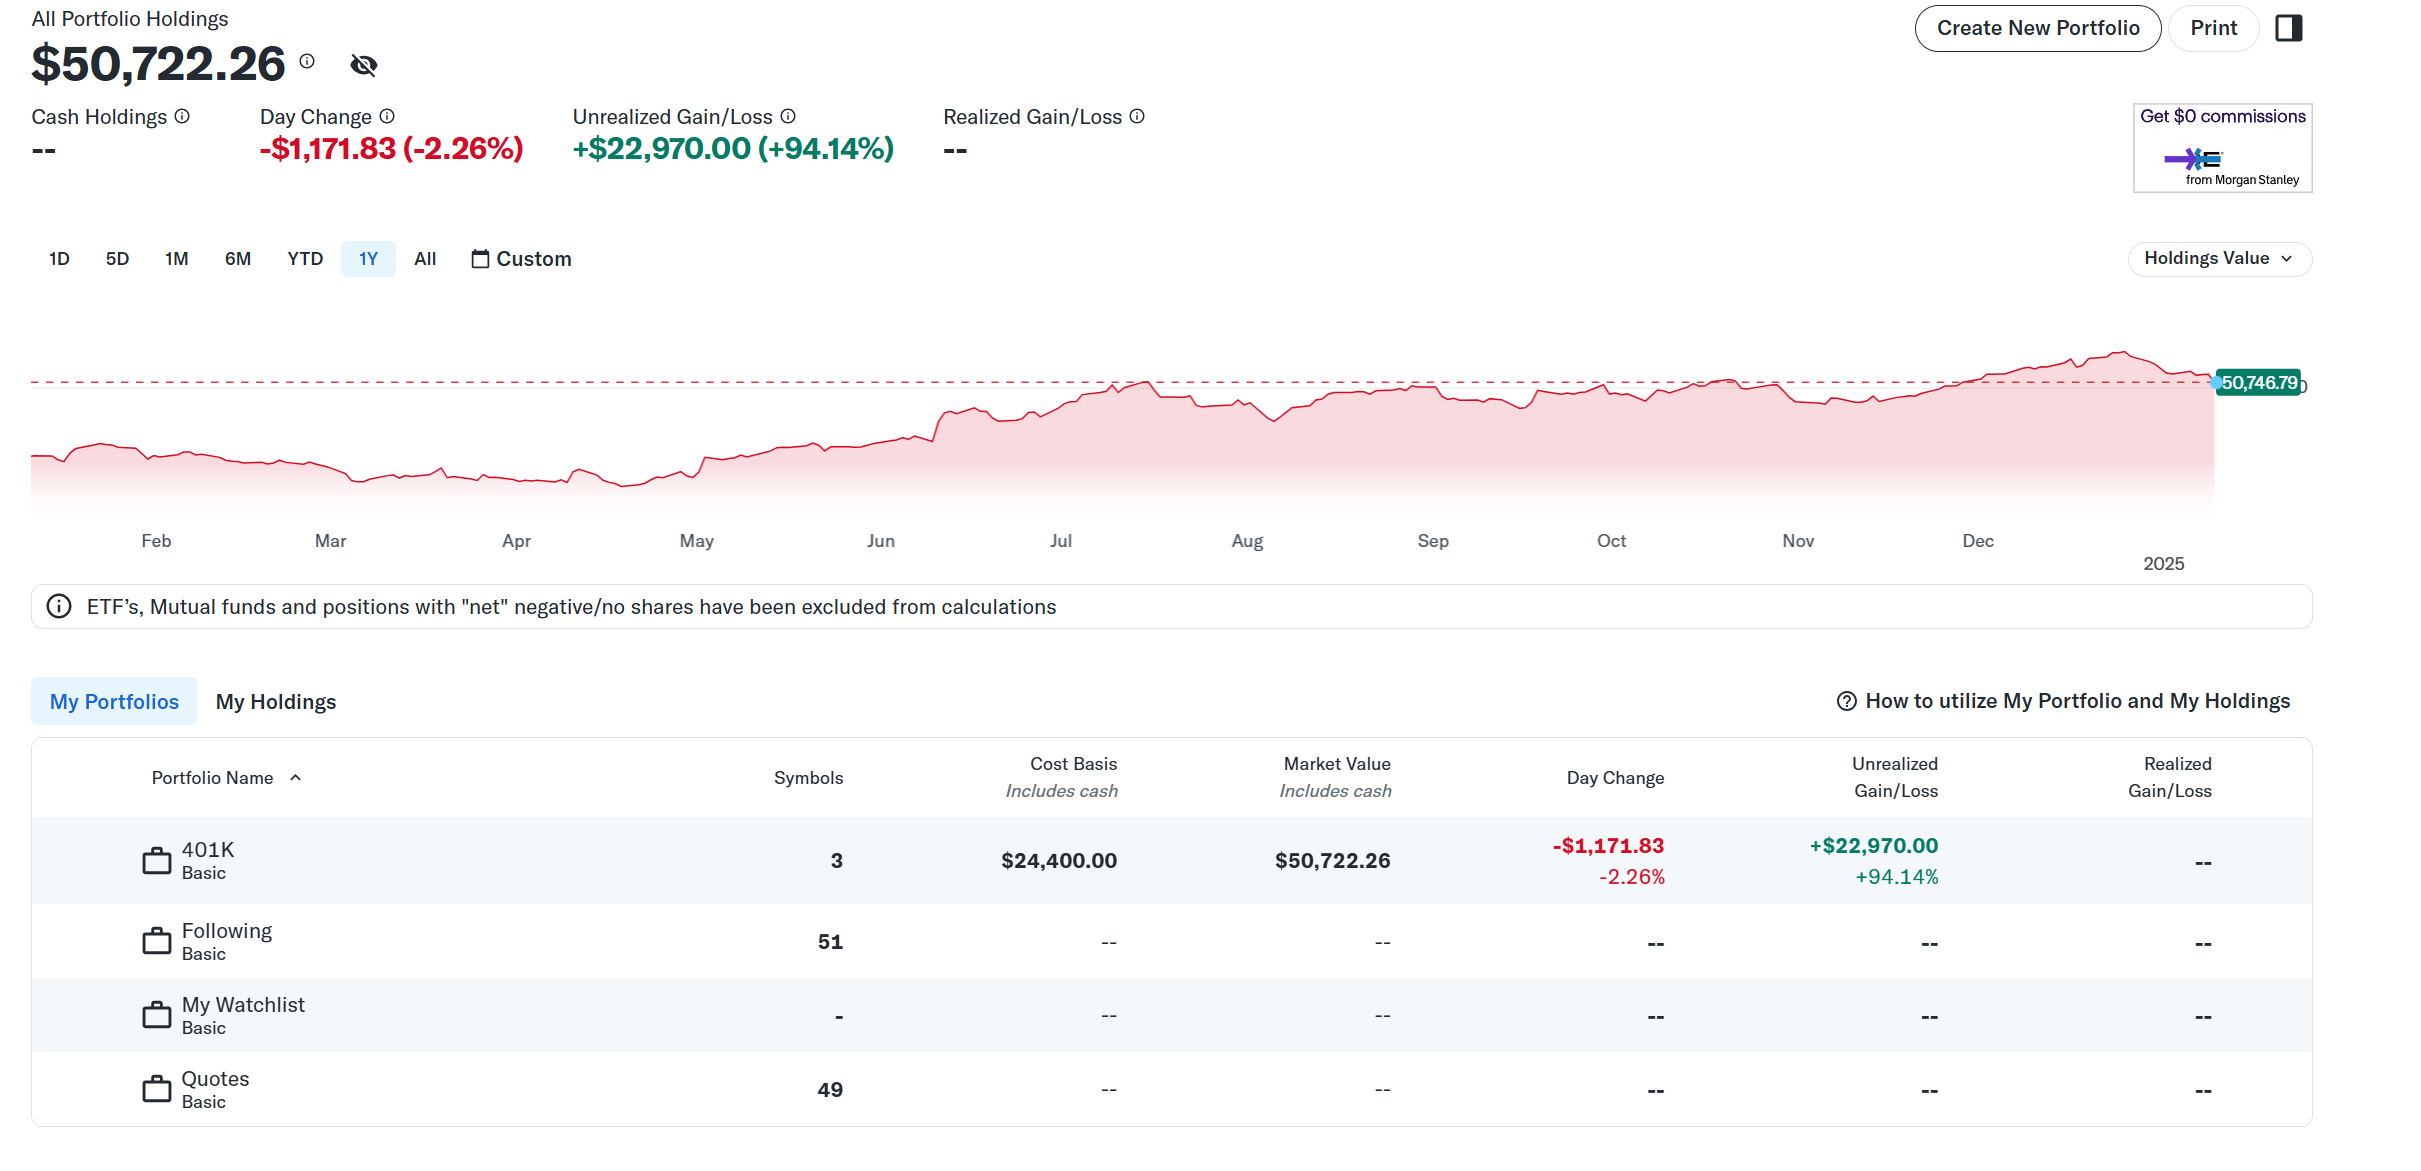
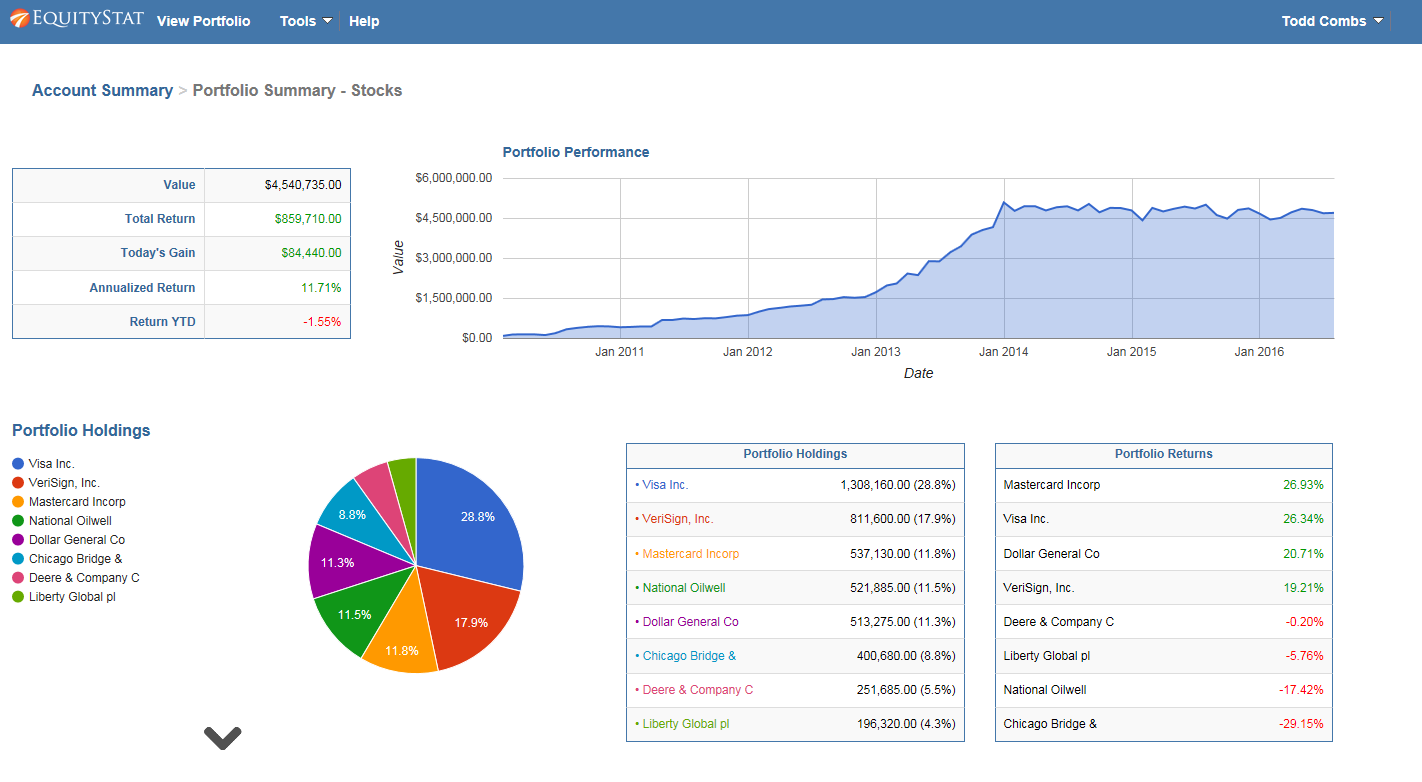
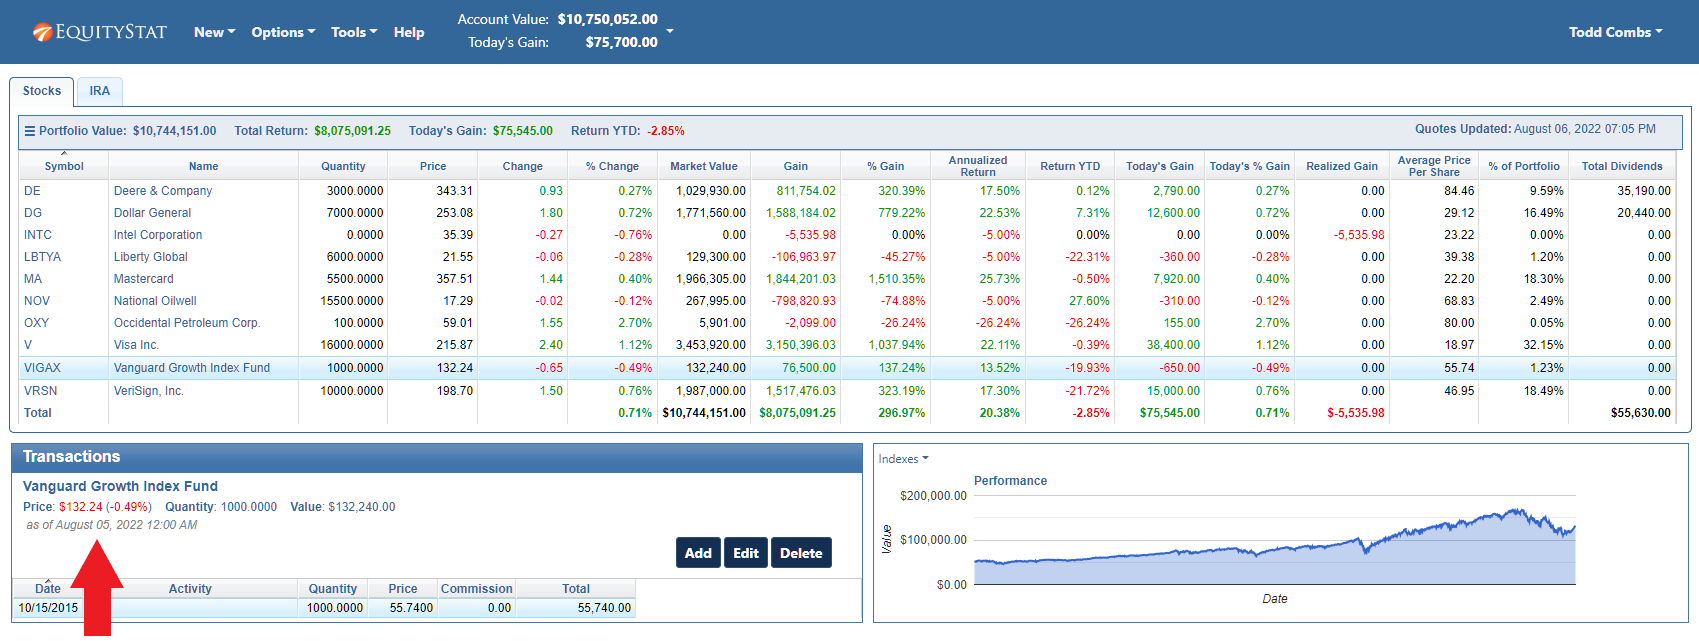
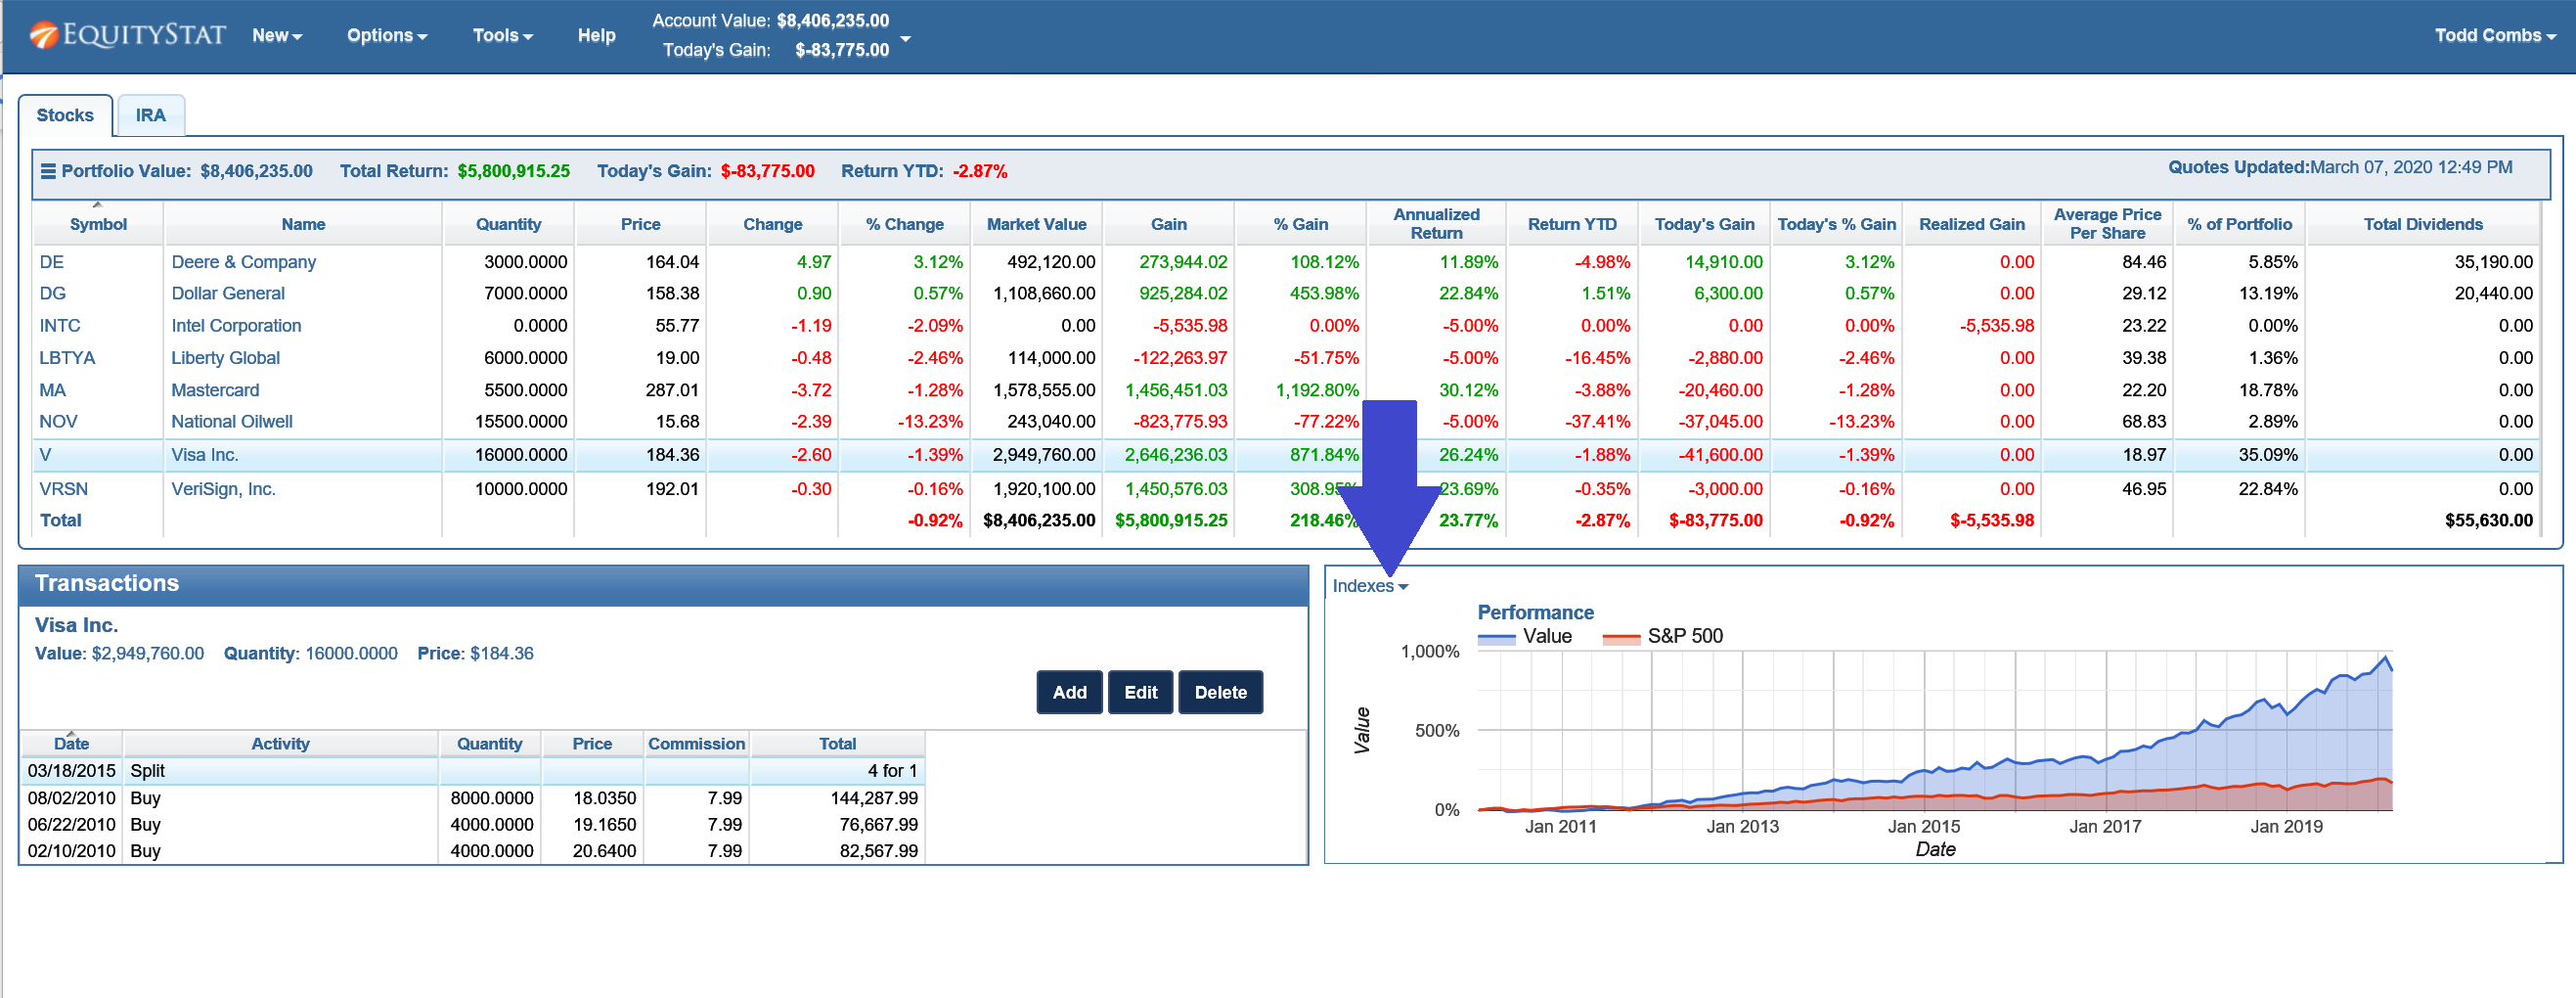
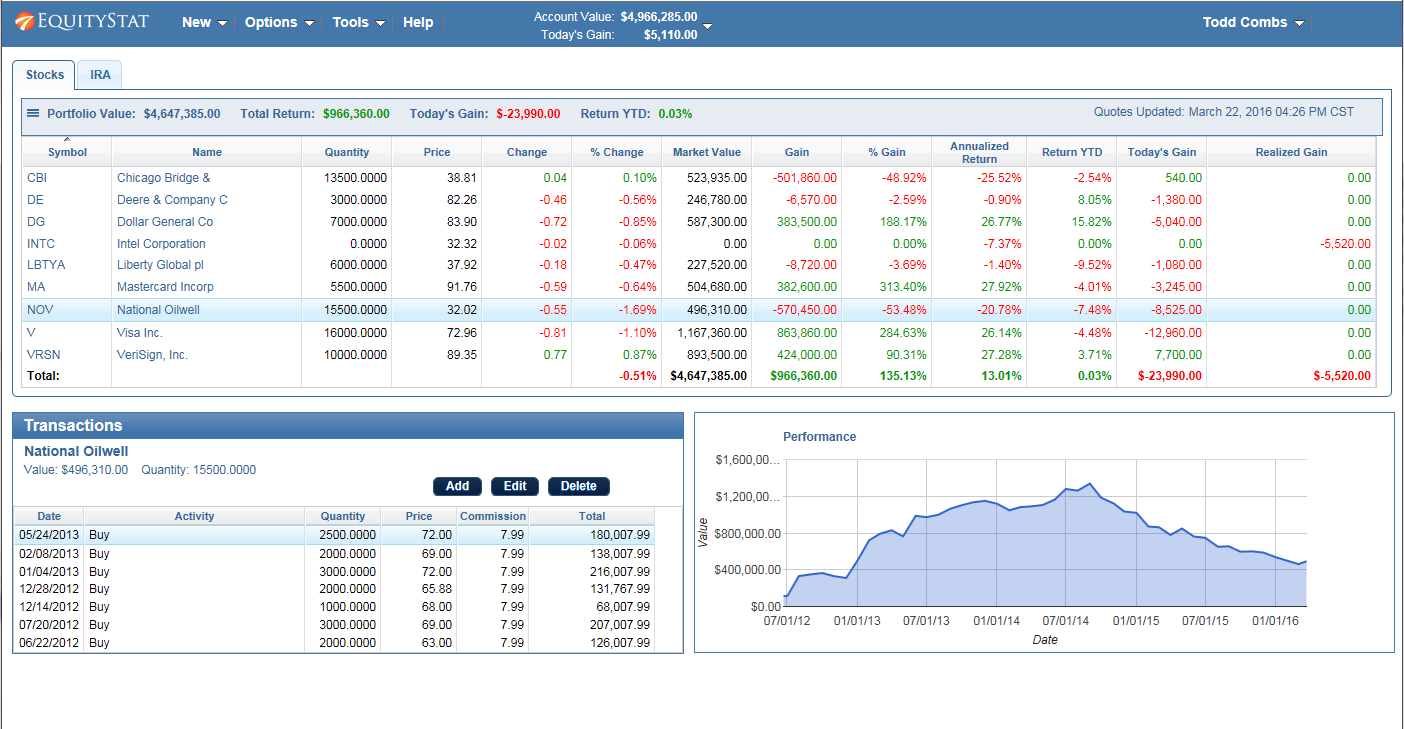
EquityStat is a stock portfolio tracker application that consolidates every investment account you have, including brokerage accounts, 401(k)s, IRAs, and more, and every asset type you hold in them, including stocks, bonds, ETFs, and mutual funds, into a single dashboard. Instead of multiple logins and multiple different partial pictures, you get one.
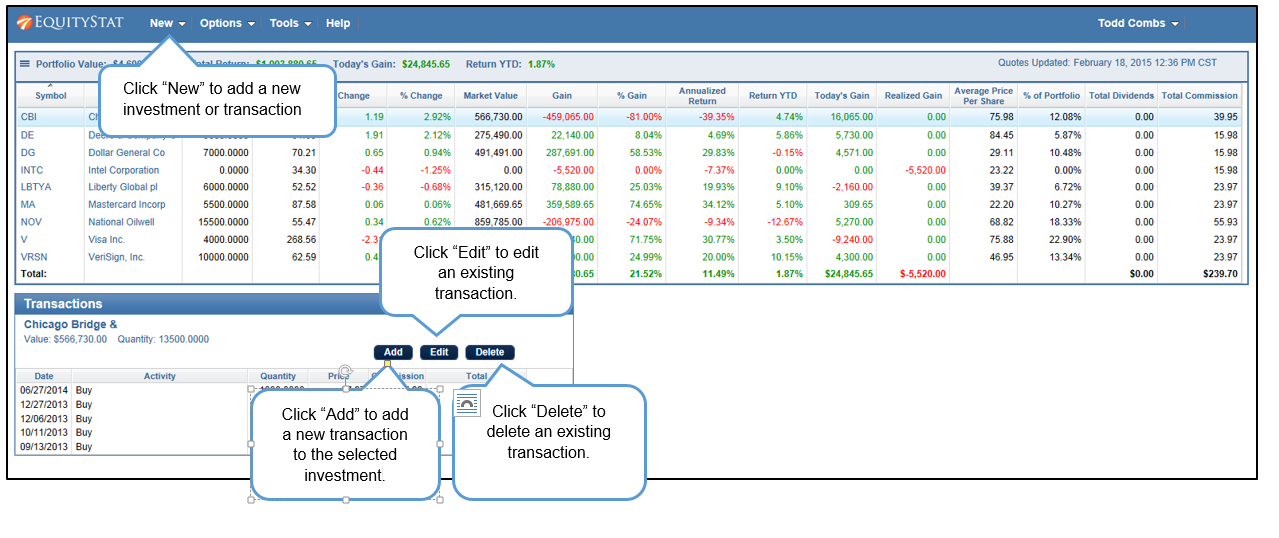
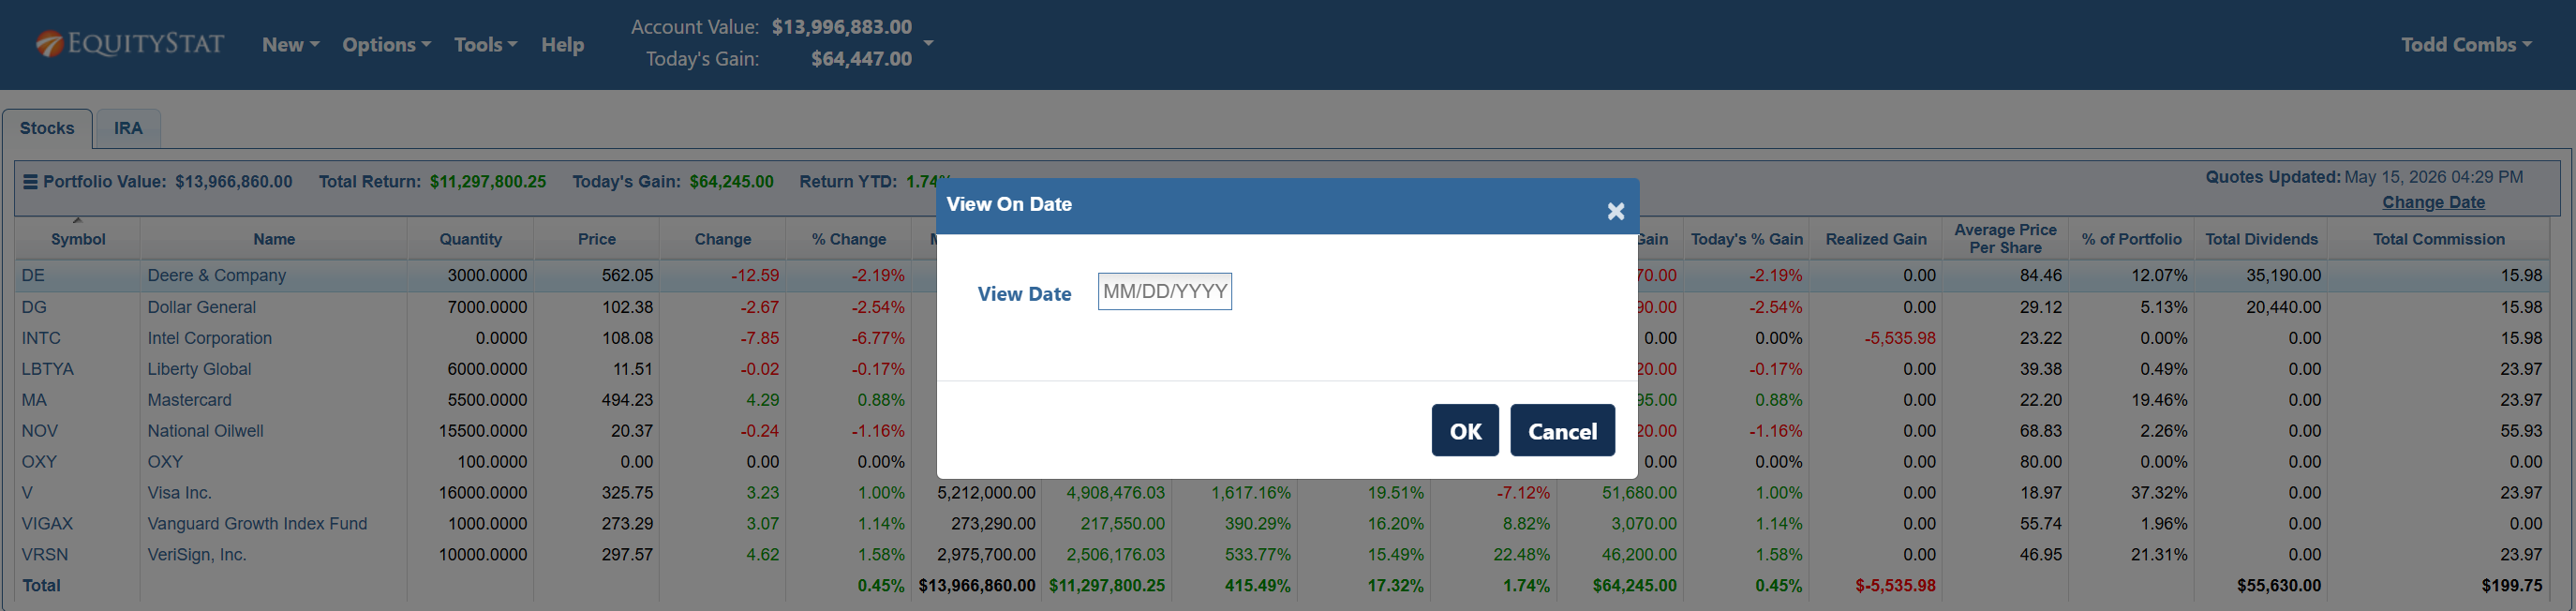
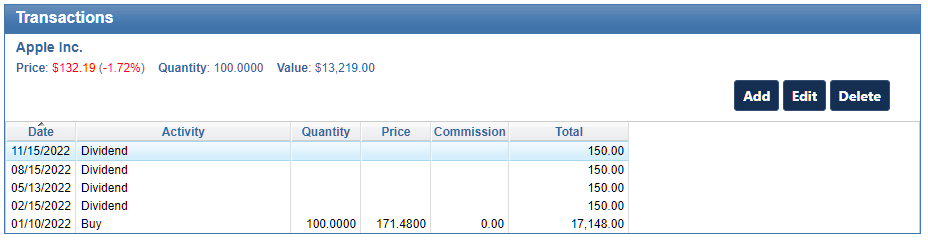
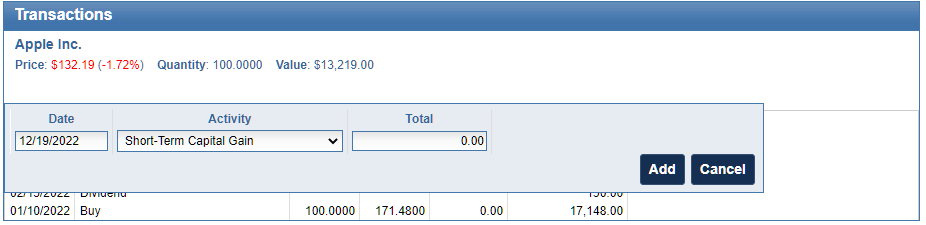
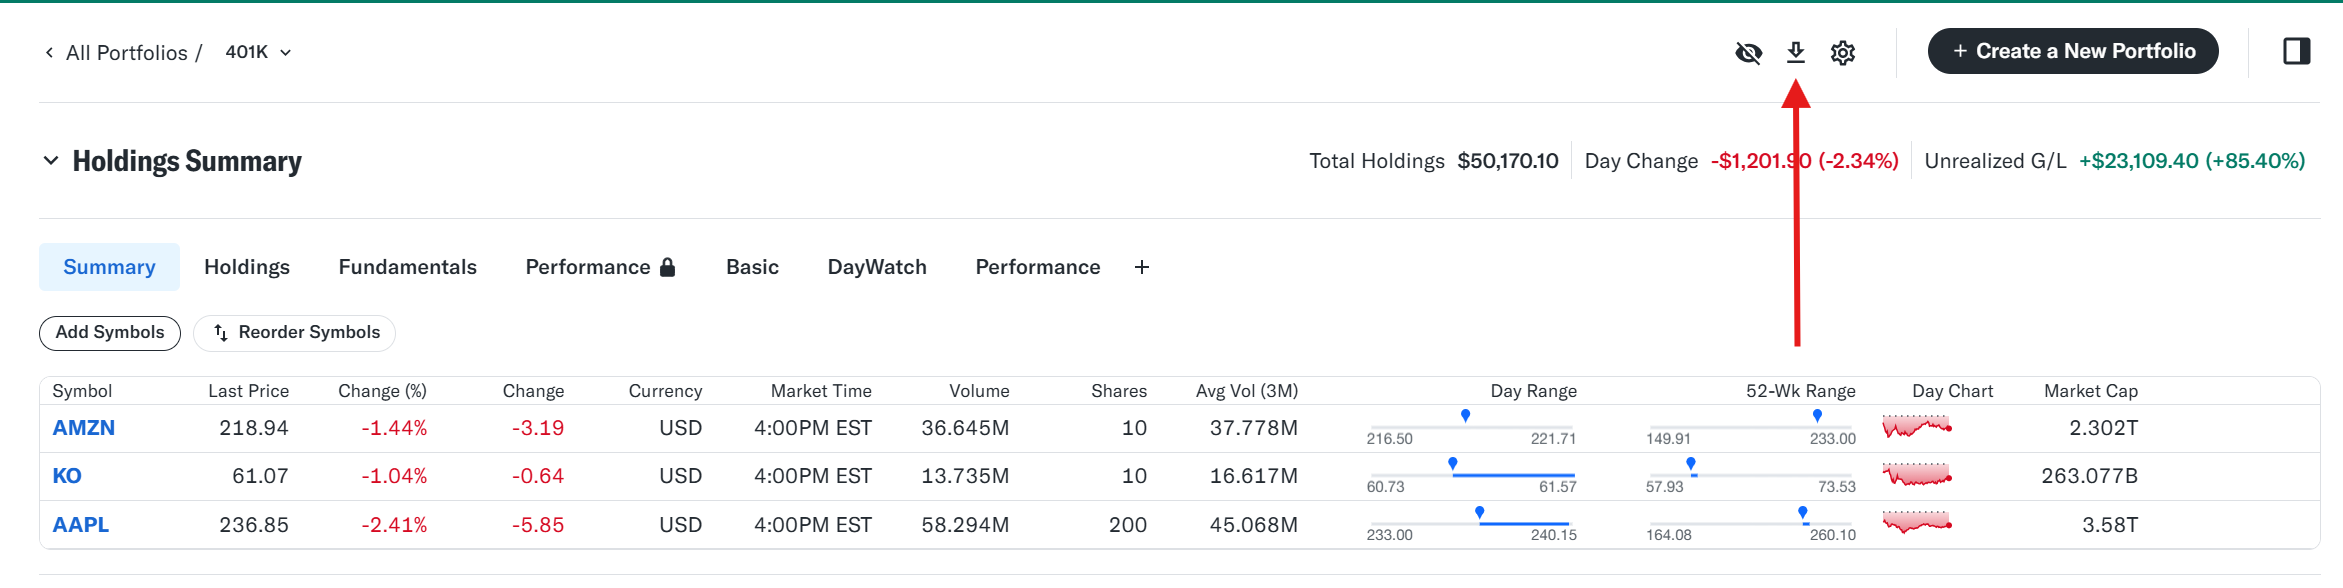
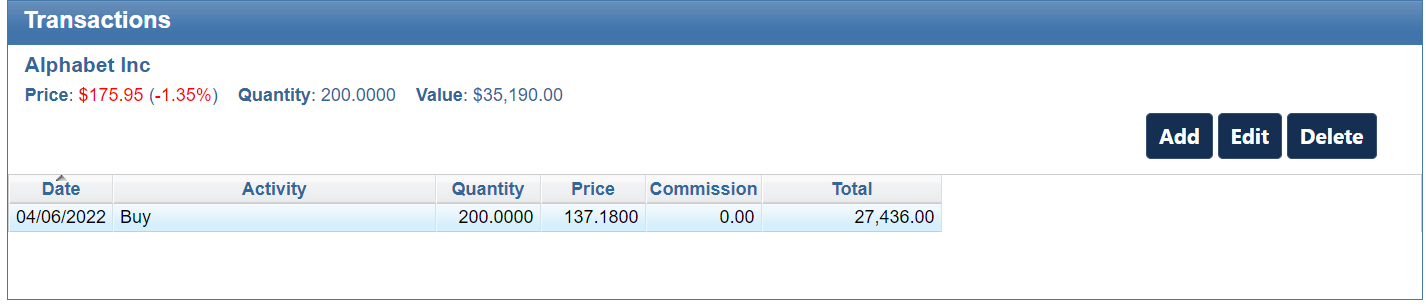
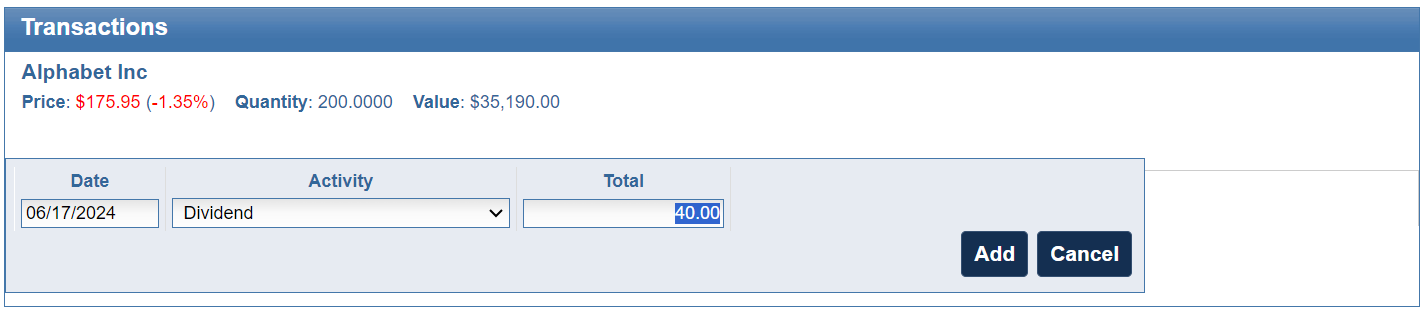
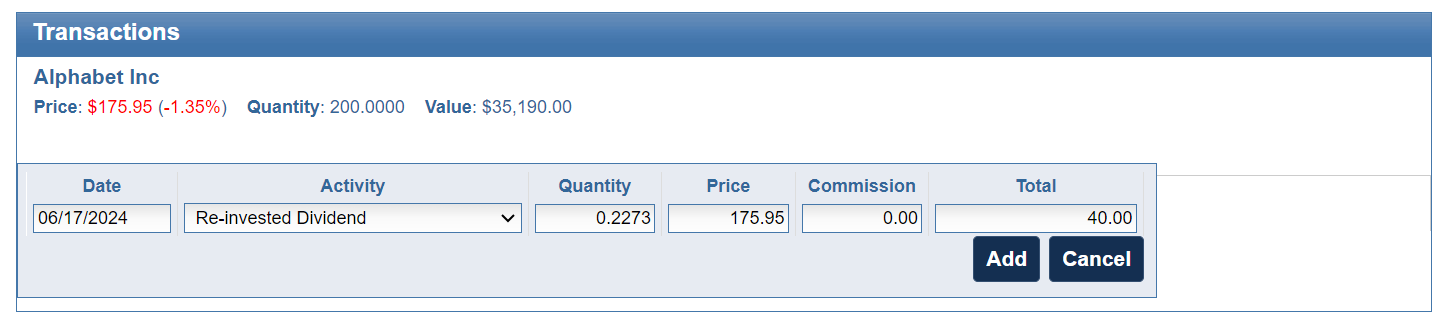
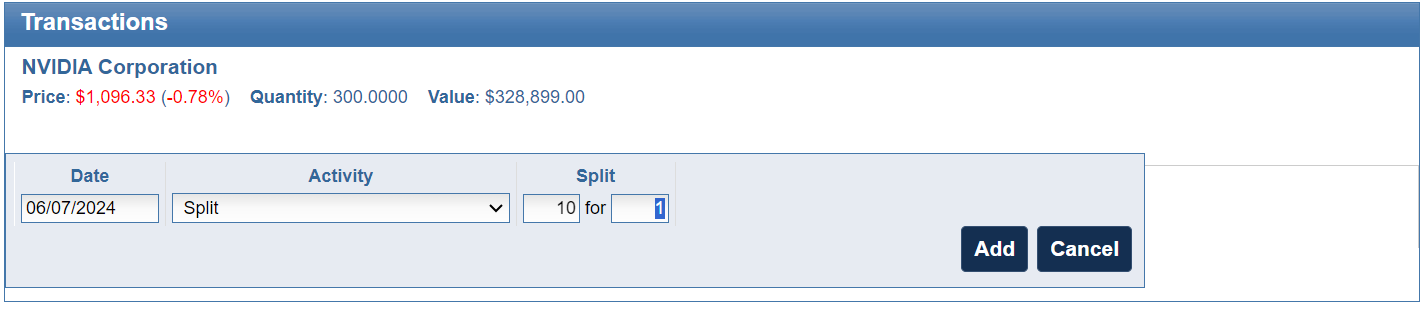
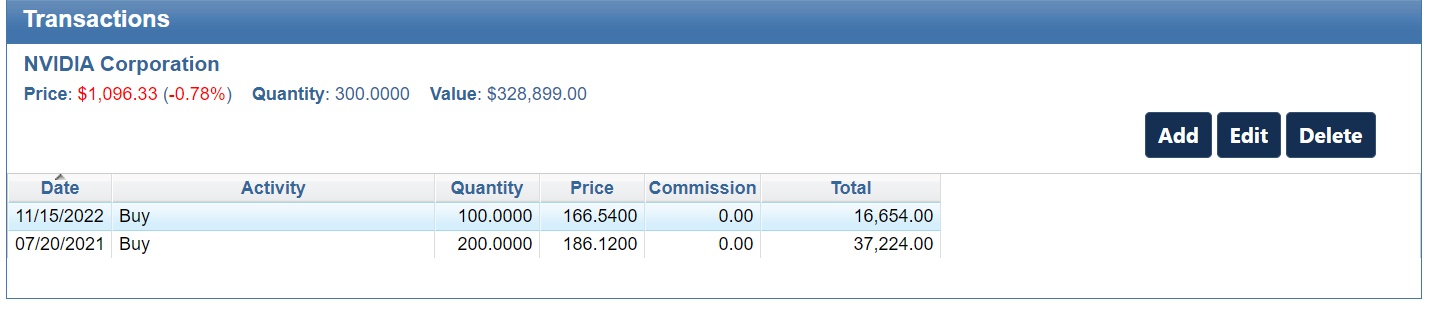
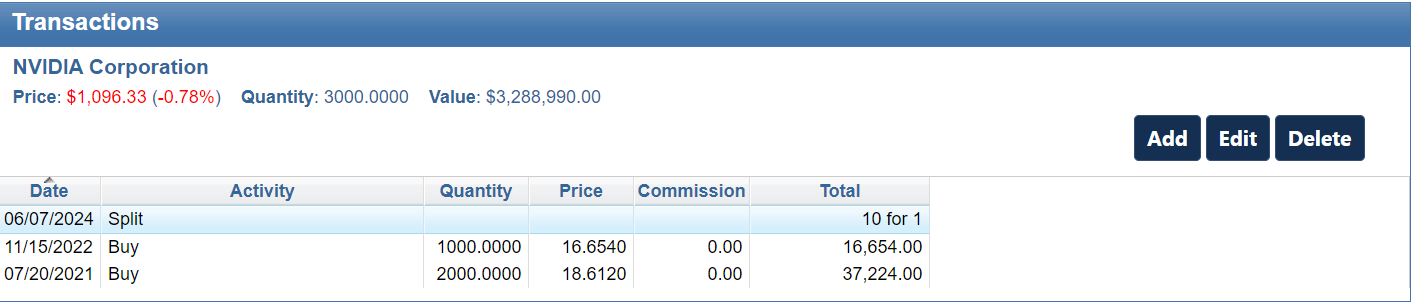
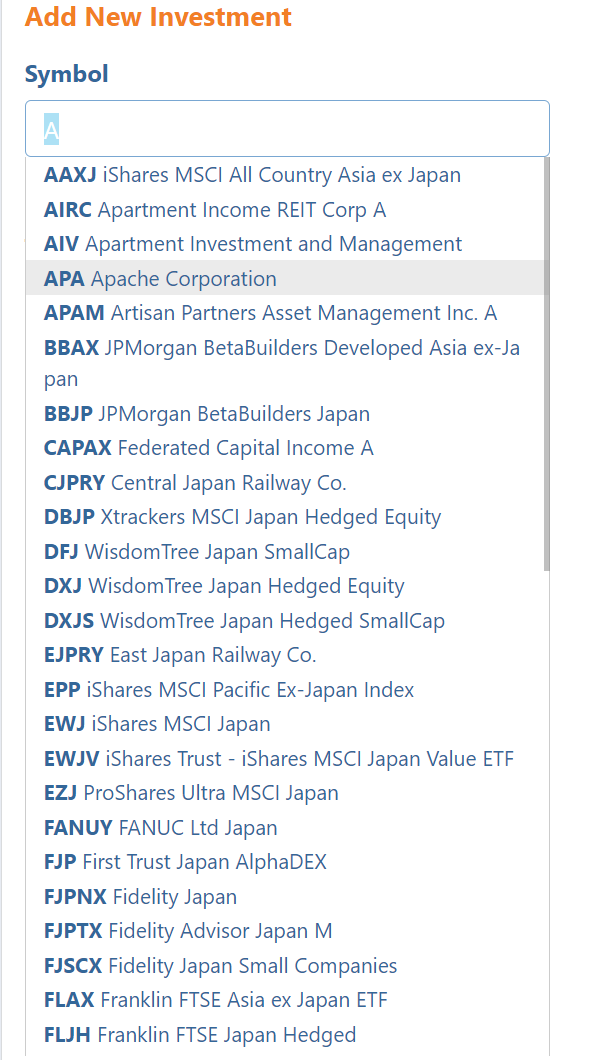
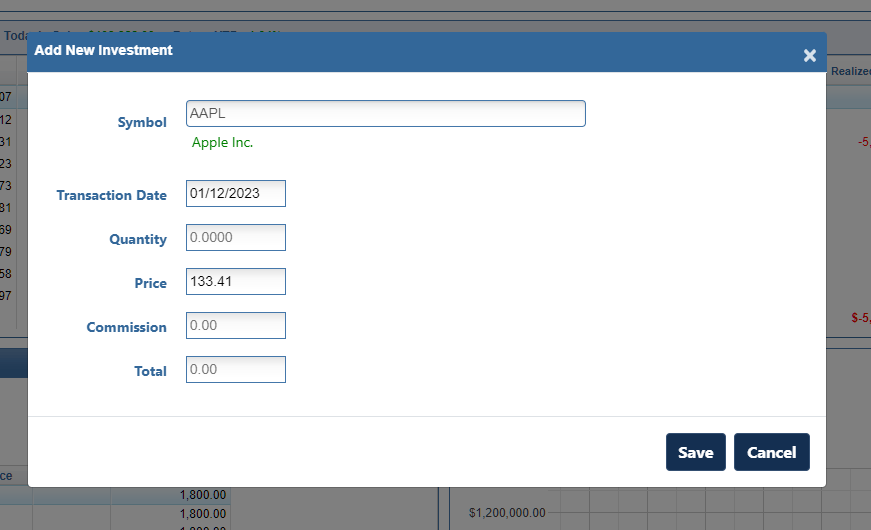
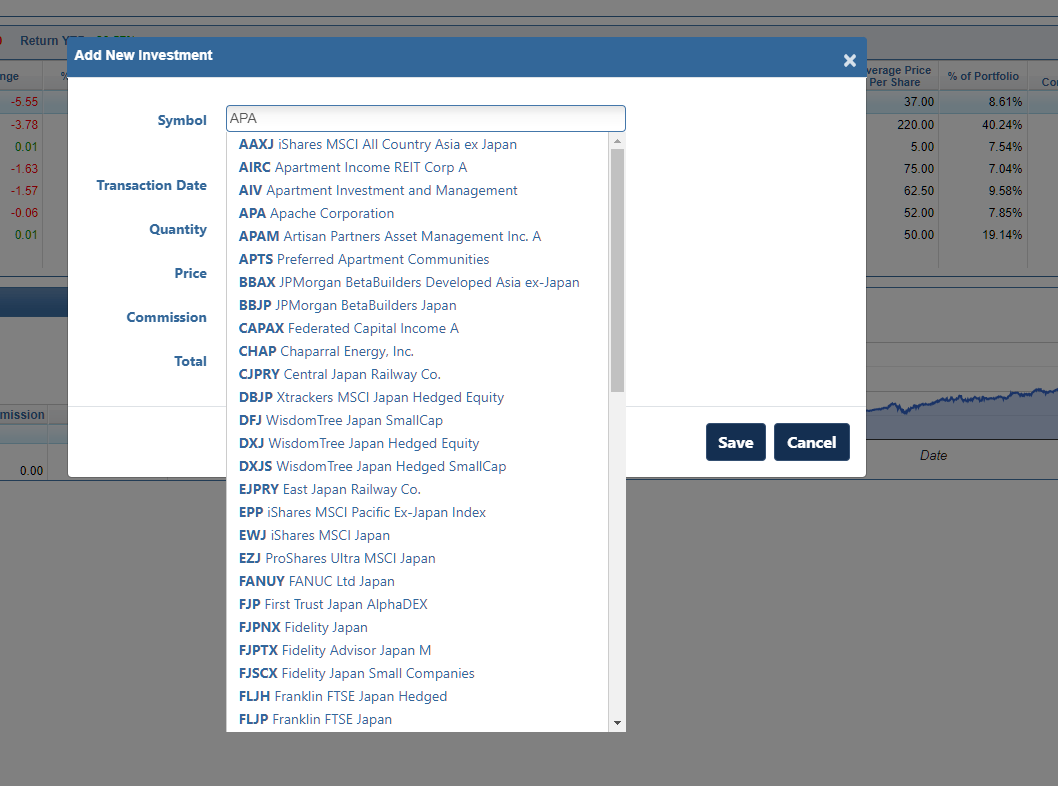
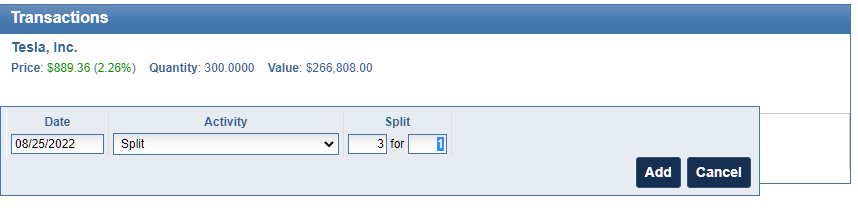
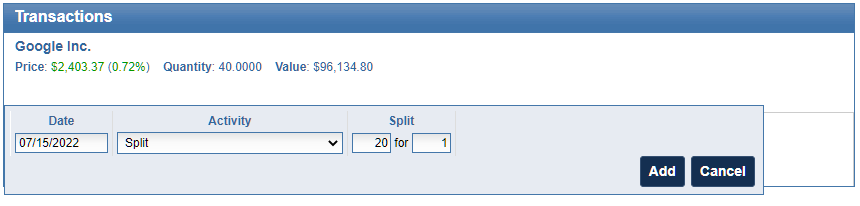
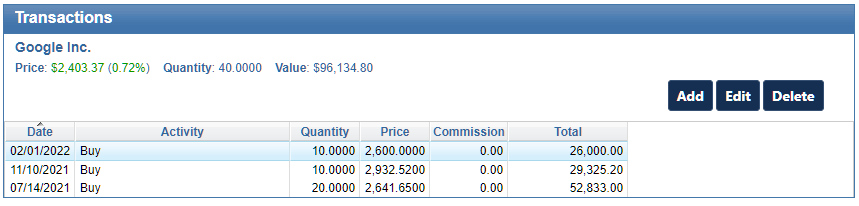
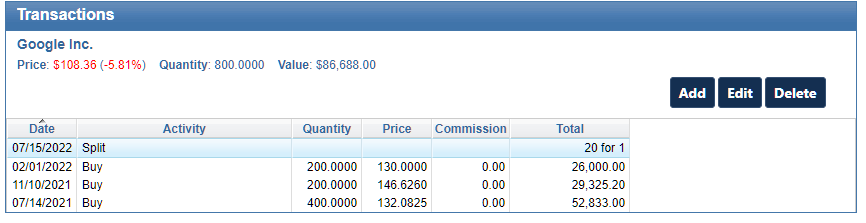
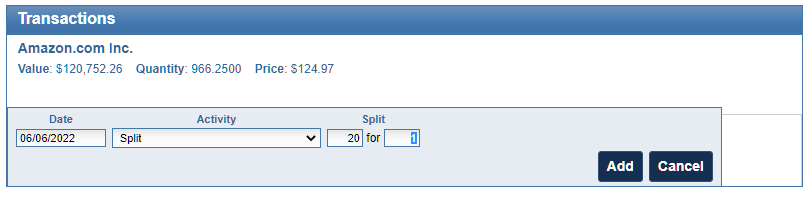
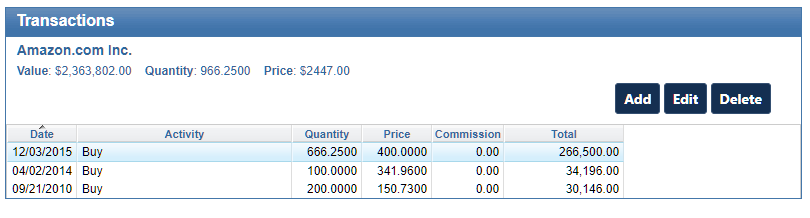
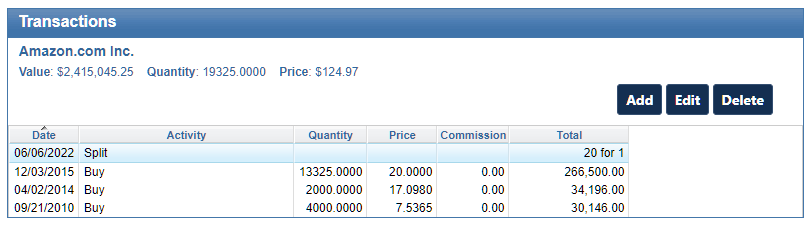
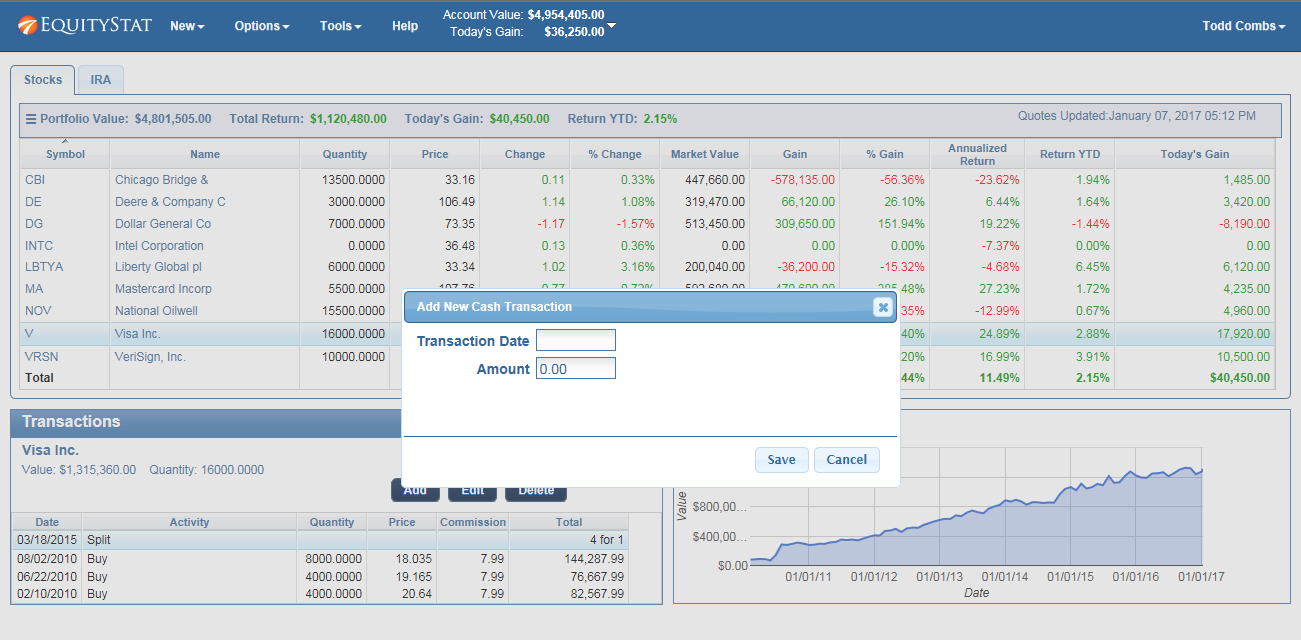
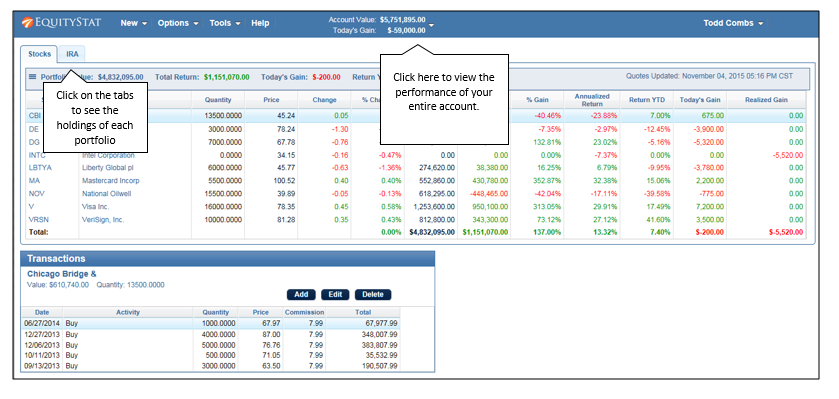
Once your accounts are in, EquityStat goes well beyond just listing what you own. As a full stock portfolio manager, it calculates gain, quarterly return, year-to-date return, and annualized return for each holding, portfolio, and account. It works as a dedicated stock dividend tracker, logging dividends down to the individual investment level, and it lets you record buys, sells, and splits for each holding. You can even go back in time and see exactly what your portfolio looked like on any past date, something a spreadsheet or a single brokerage login simply can’t do across accounts.
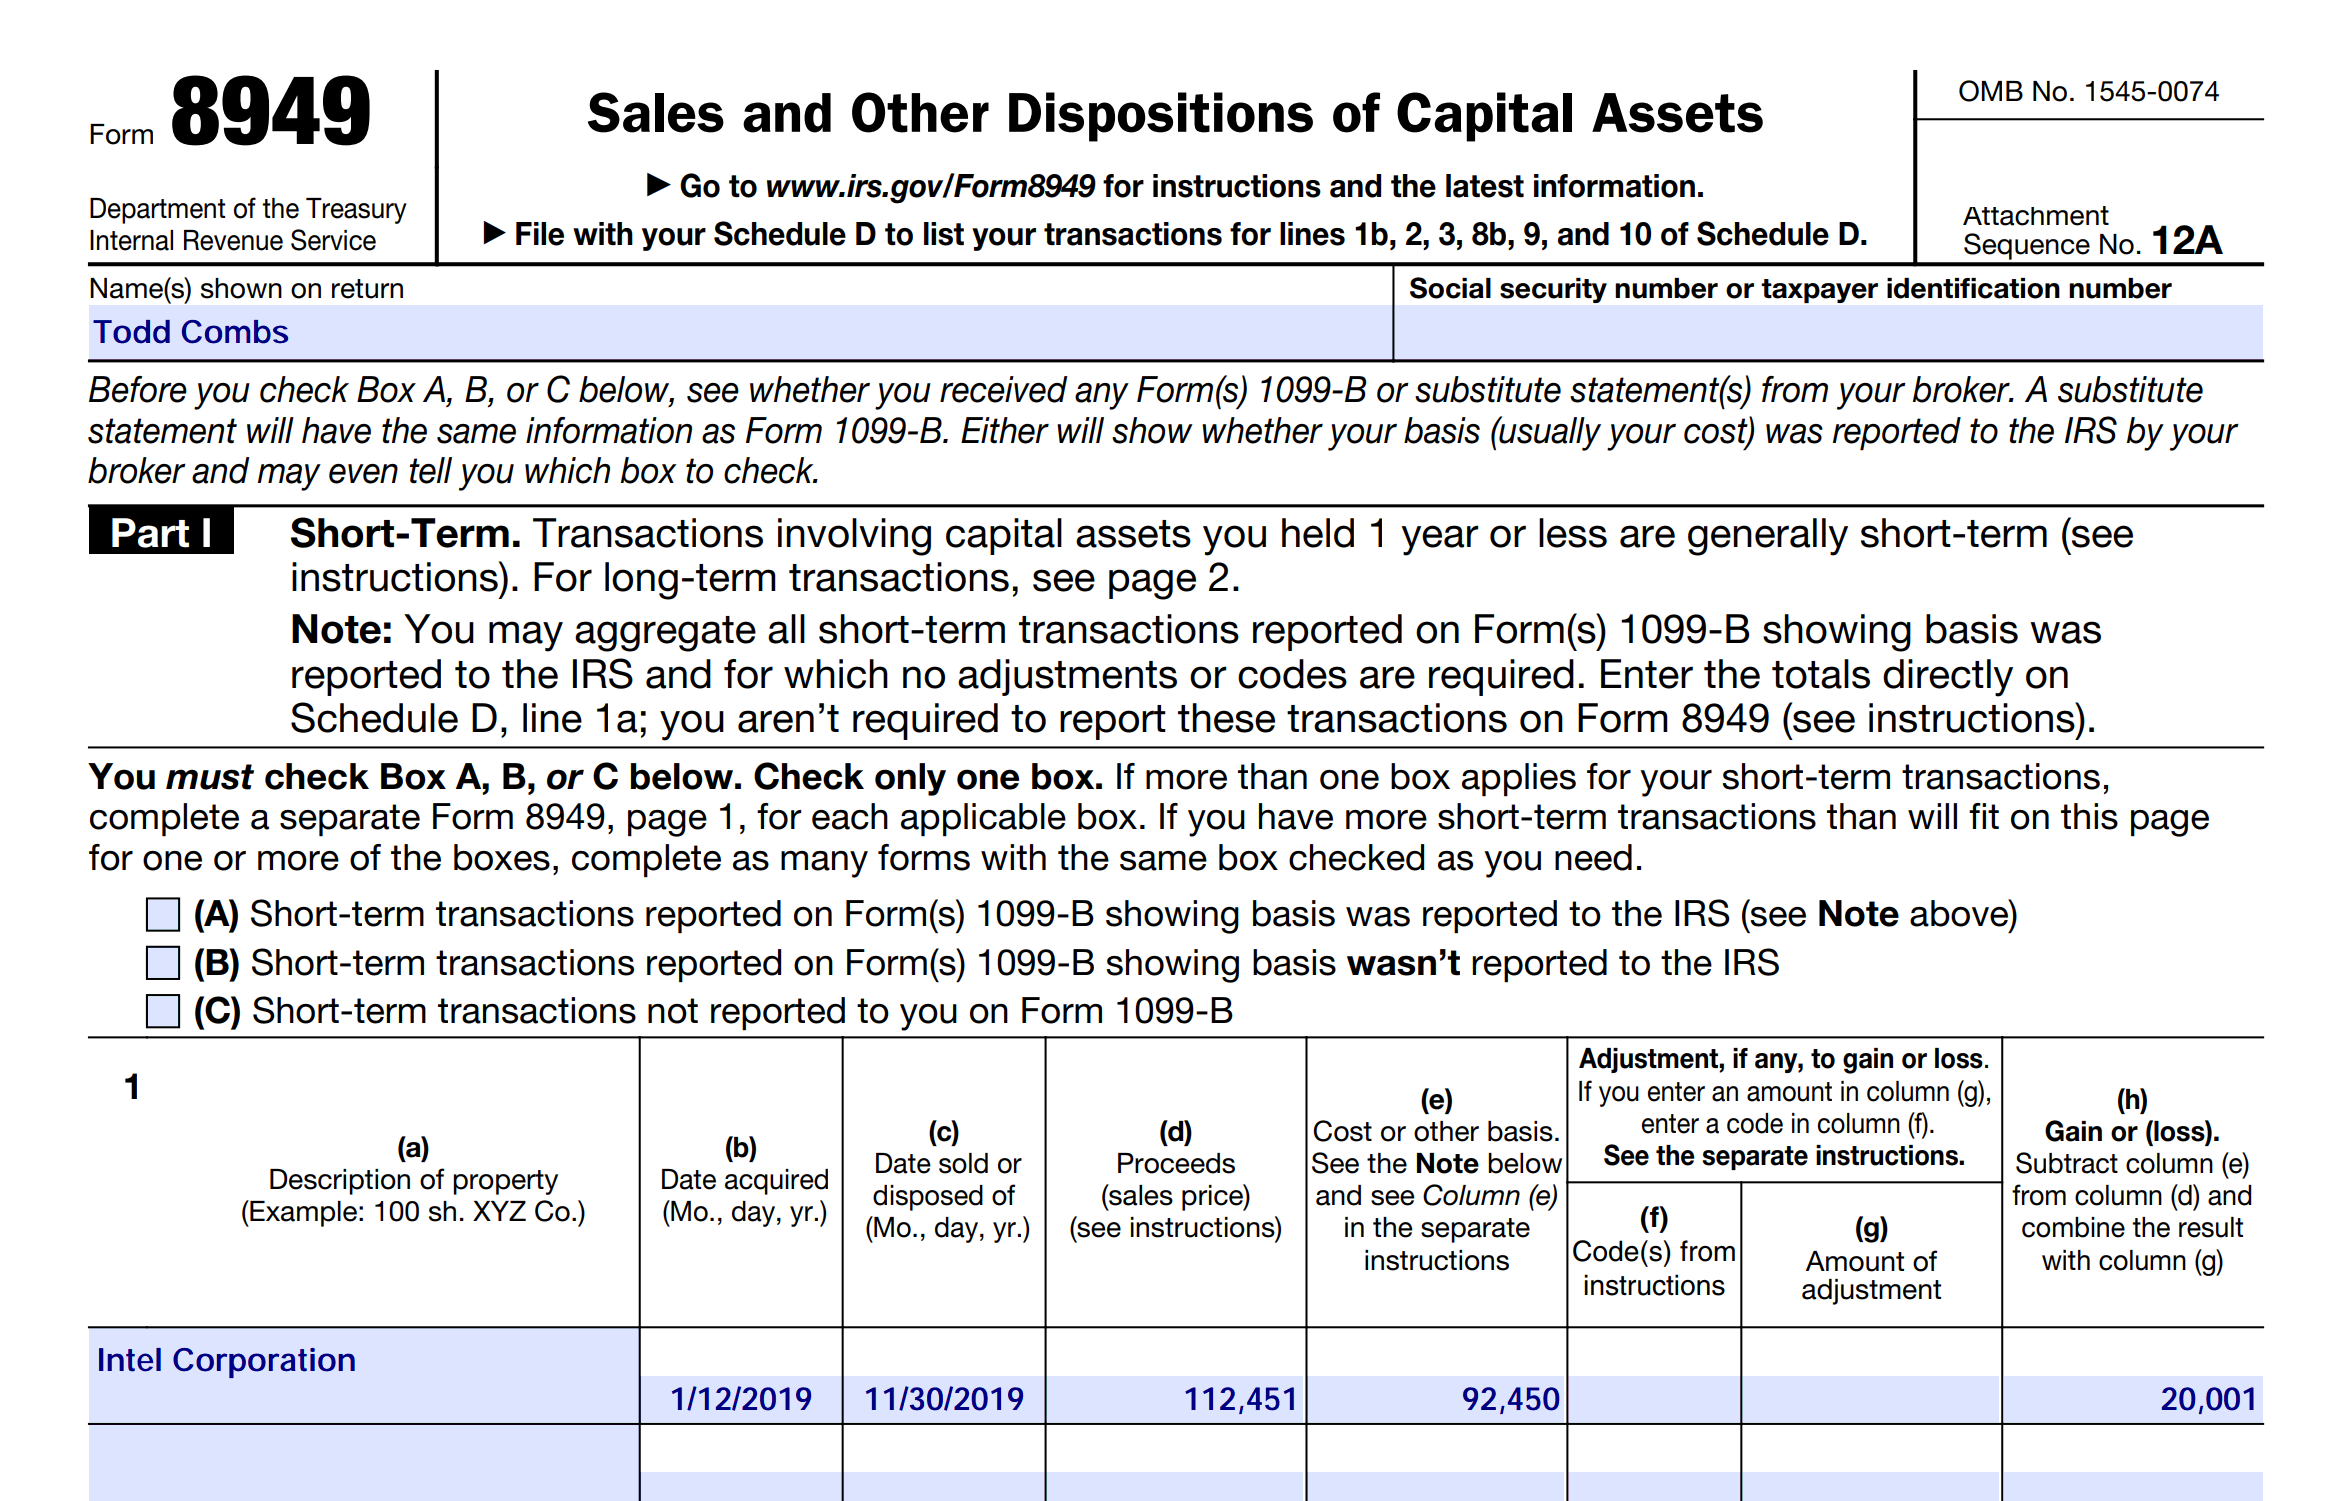
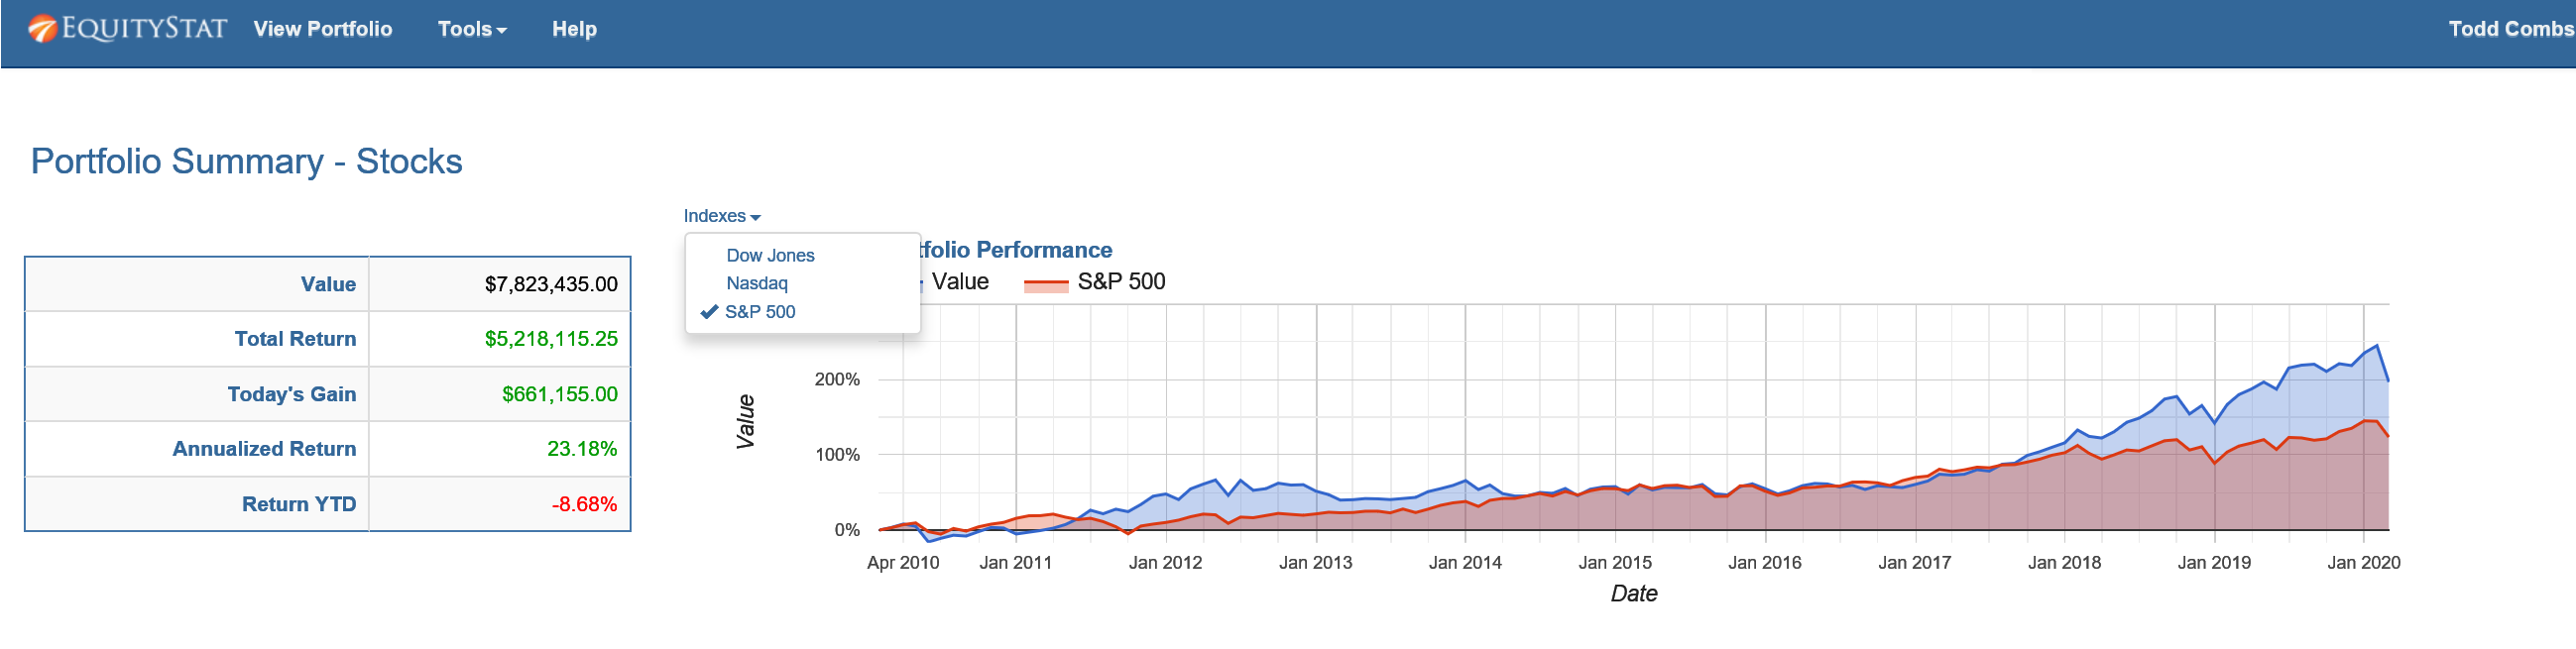
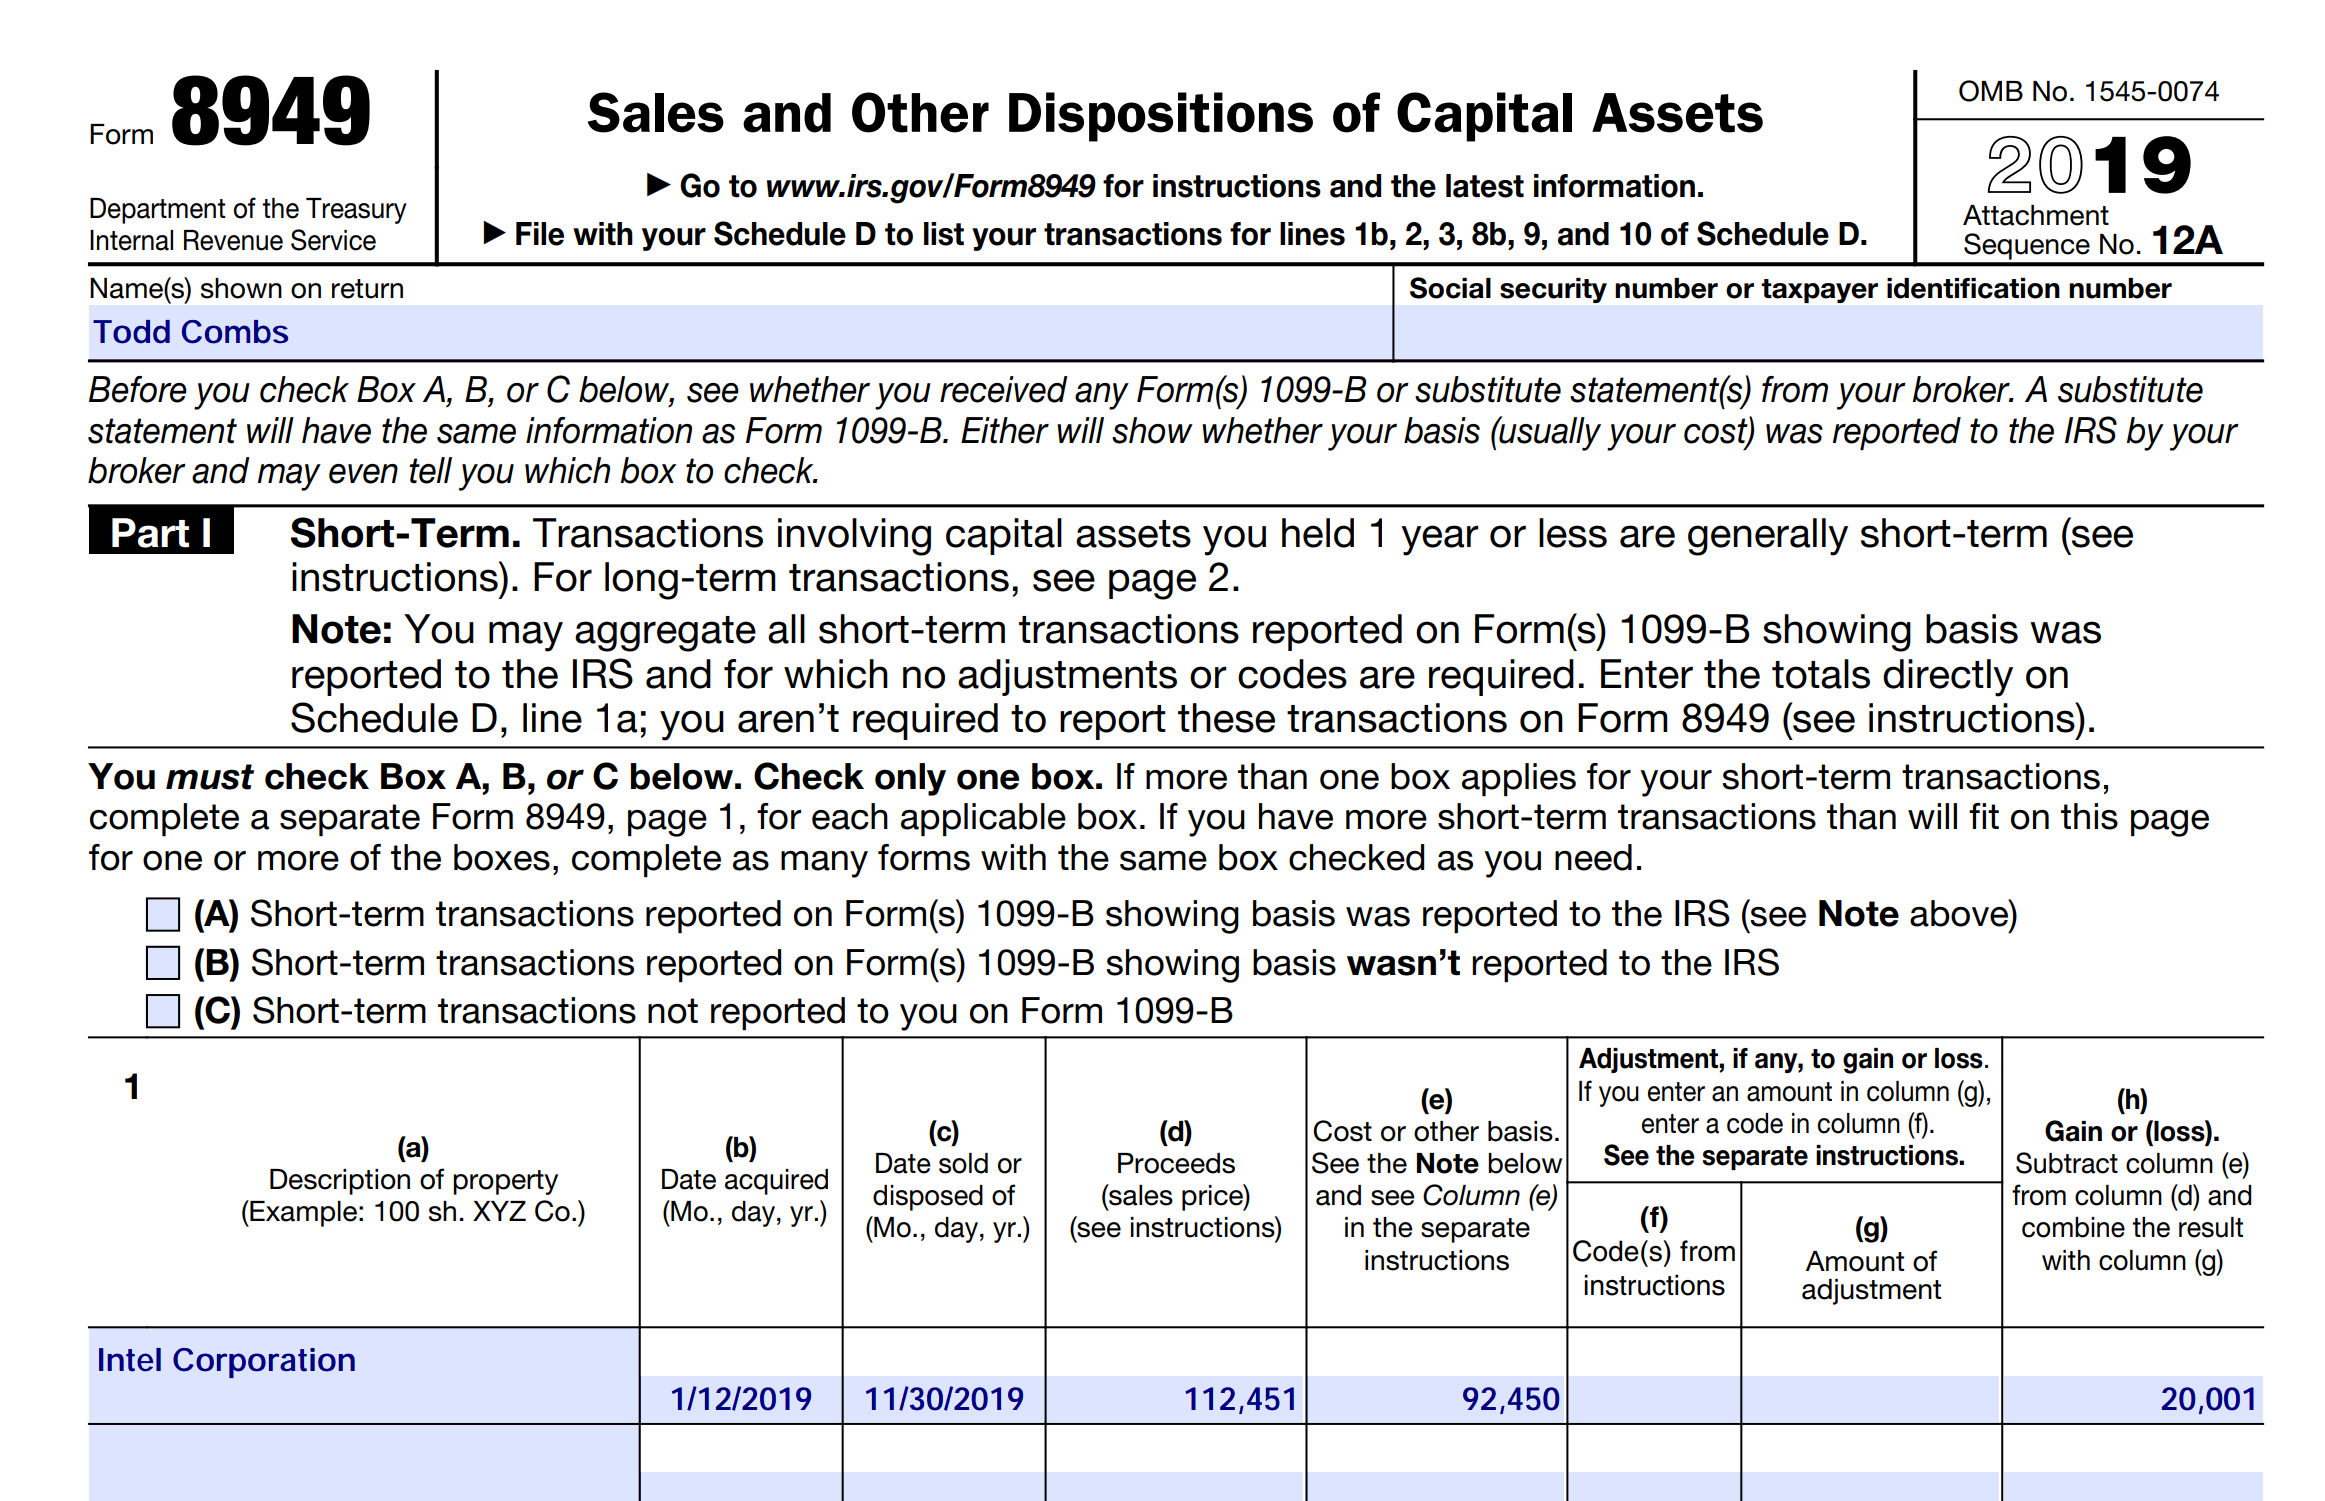
On the analysis side, EquityStat delivers summary performance graphs, individual investment performance graphs, and benchmark comparisons against the S&P 500, Dow Jones, and Nasdaq, at the account level, the portfolio level, or drilled down to a single holding. It also generates IRS Form 8949 and calculates cost basis, gains, and losses, so tax season doesn’t mean reconstructing a year of transactions by hand.
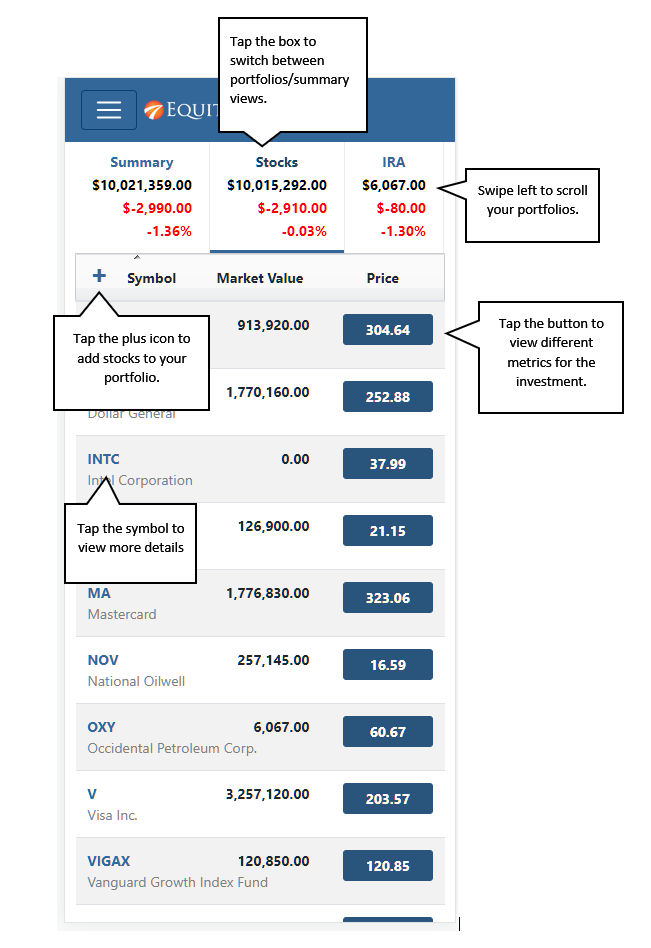
And because it’s built for how people actually check their investments, it’s accessible on desktop, tablet, or smartphone, with a responsive interface you can customize, choosing which metrics and columns display, and sorting holdings or transactions by the order that works best for you.
Why EquityStat?
Here’s the core problem EquityStat solves: if your investments are spread across multiple accounts, you cannot actually see your real financial picture without aggregating them somewhere. Your brokerage app only knows about your brokerage account. Your 401(k) provider only knows about your 401(k). Neither one can tell you your total return across everything you own, your combined dividend income, or how your overall asset allocation looks once every account is counted together. That picture only exists if something pulls all the pieces into one place, and that’s exactly what a good stock portfolio tracker is for.
This is the reason a spreadsheet isn’t really a solution, either. Building one manually means looking up prices by hand, recalculating returns yourself, and updating the whole thing every time you make a trade. EquityStat handles the price side of that automatically, pulling current stock, mutual fund, and ETF quotes and recalculating your returns in real time, so once you’ve logged a trade, your performance numbers stay current without any extra work.
The payoff is real financial clarity. When every account rolls up into one stock portfolio manager, you can finally answer the questions that actually matter: Is my overall net worth going up? Which of my accounts is actually performing best? How much am I really earning in dividends across everything I own? Am I overexposed to one sector once you count my 401(k) alongside my brokerage account? None of those questions can be answered by looking at accounts one at a time, they require aggregation, which is the entire reason EquityStat exists.
For investors who’ve been checking three or four different logins just to get a partial sense of where they stand, that single consolidated view is the difference between managing your investments and merely monitoring pieces of them. That’s why EquityStat is built the way it is, as one place to aggregate everything, so you always know exactly where you stand.
Frequently Asked Questions
Who built EquityStat? EquityStat was built by investors who were managing their own portfolios and found the available tracking tools incomplete.
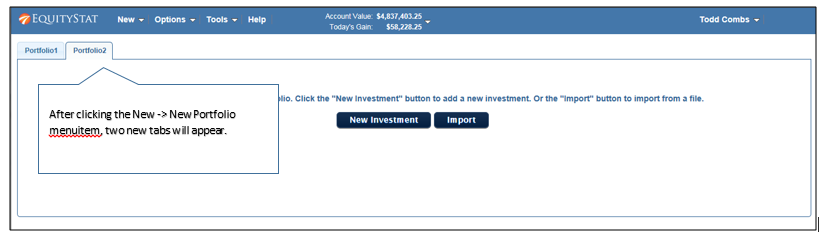
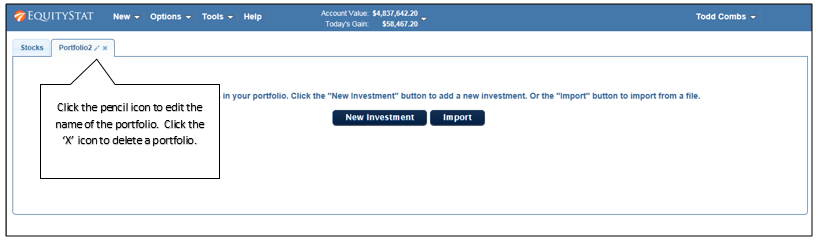
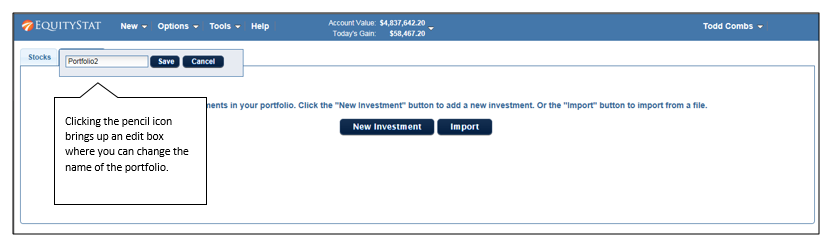
What accounts can EquityStat track? Brokerage accounts, 401(k)s, IRAs, and other account types can all be tracked side by side, and organized into separate portfolios if you want to keep them distinct.
Why do I need to aggregate my investment accounts in one place? Because no single brokerage or plan provider can show you your total return, combined dividend income, or overall asset allocation across accounts they don’t have visibility into. Only a consolidated stock portfolio tracker can show you that complete picture.
Has EquityStat been reviewed by any outside publications? Yes. Kiplinger Magazine names EquityStat a top stock portfolio tracker covering top tools for DIY stock investors, specifically recommending it as a portfolio tracker.