A Trusted Recommendation for Individual Investors
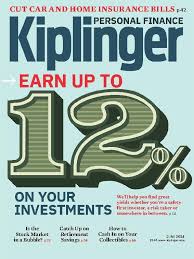
Kiplinger Magazine — one of the most respected names in personal finance — recently recognized EquityStat as one of the top tools for DIY stock investors. To build their list, Kiplinger consulted seasoned investors and long‑time Wall Street observers, selecting only platforms that deliver real value, clarity, and actionable insights.
Their verdict: EquityStat stands out as a powerful, easy‑to‑use portfolio tracking solution for everyday investors.
Why Kiplinger Highlighted EquityStat
In their review of top investing tools, Kiplinger emphasized several strengths that make EquityStat especially useful for self‑directed investors:
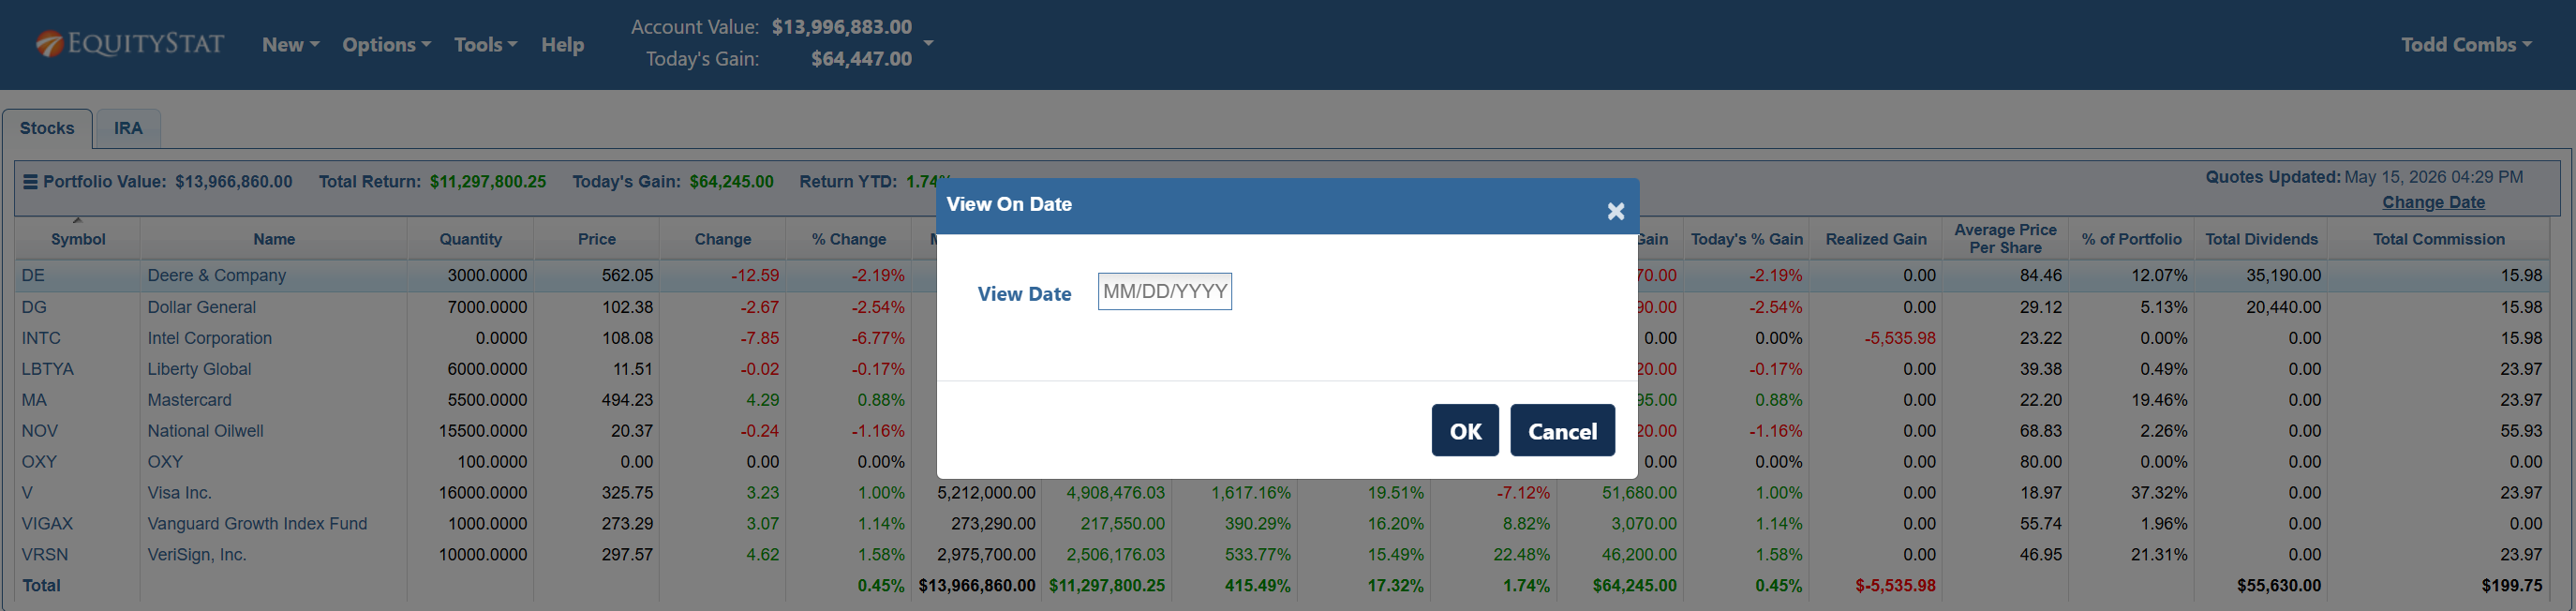
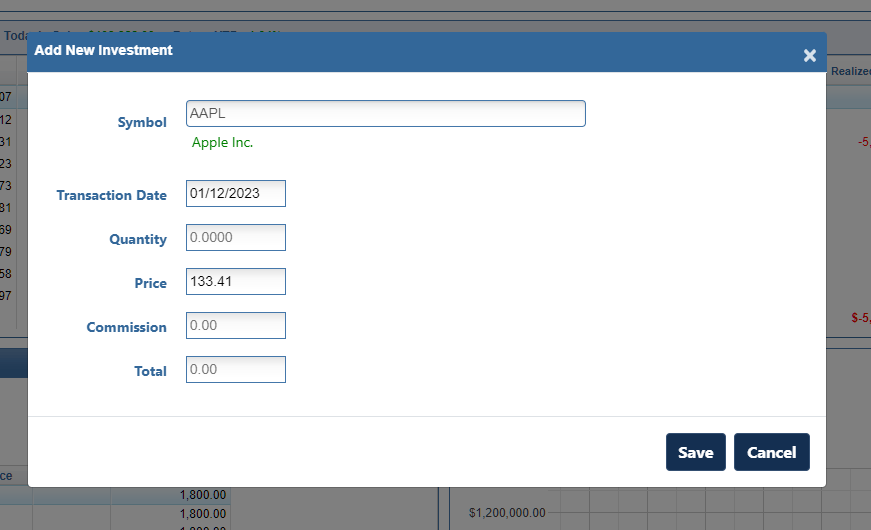
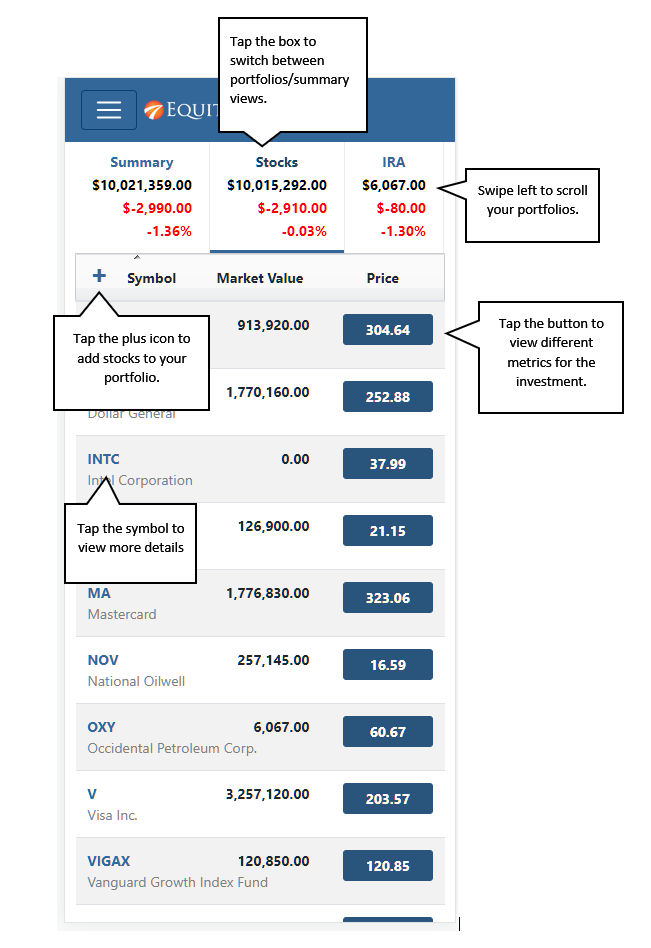
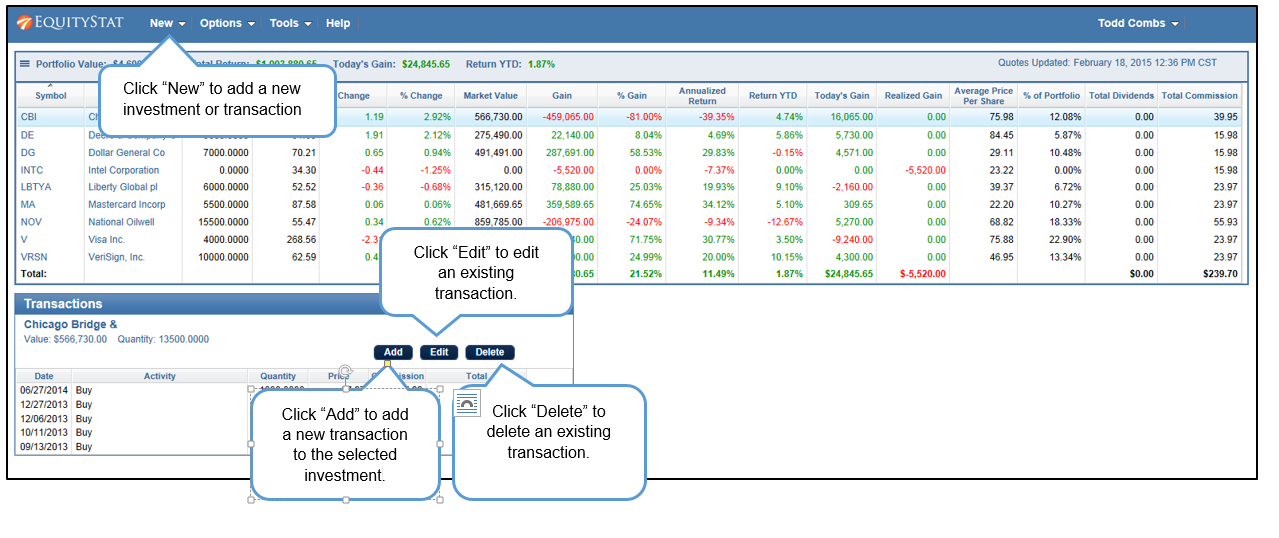
1. Fast, Simple Portfolio Setup
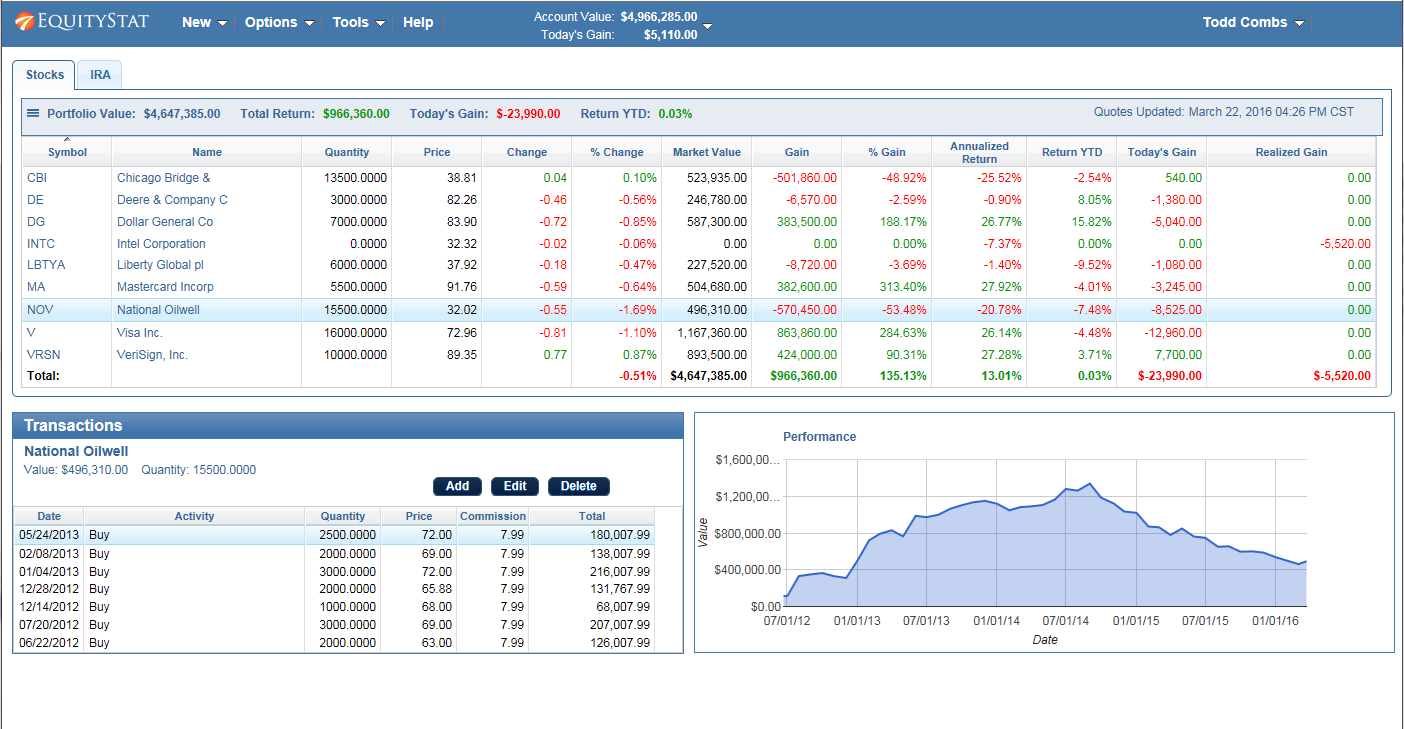
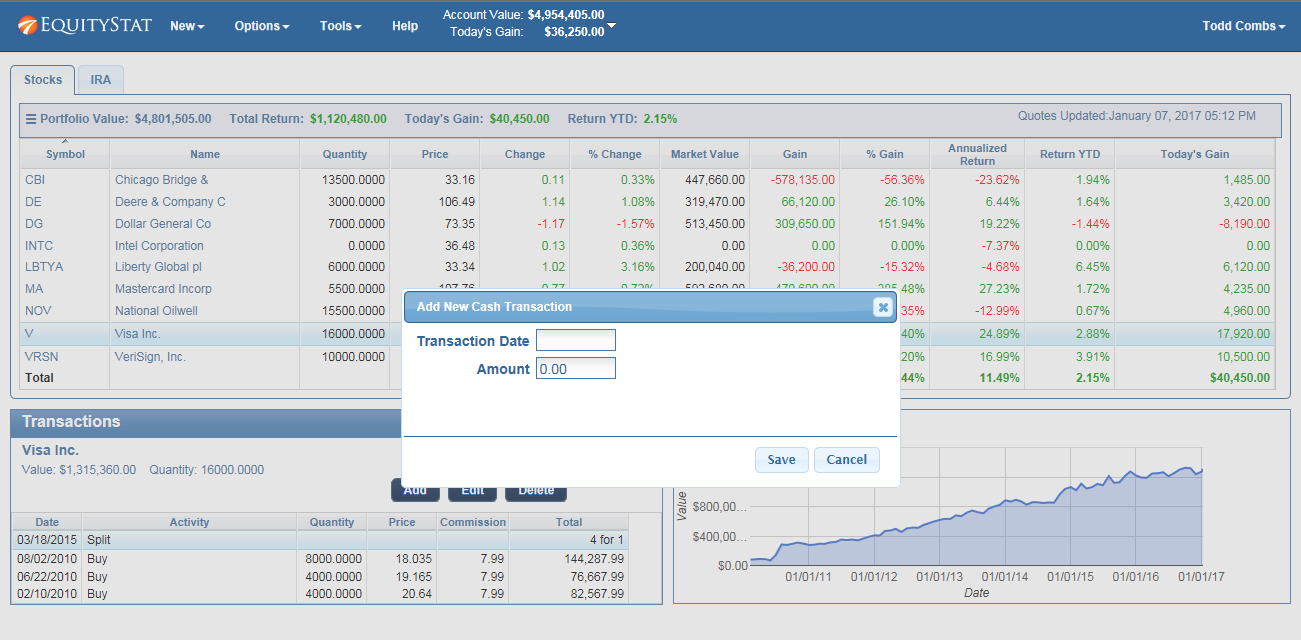
Kiplinger noted that EquityStat makes it incredibly easy to build a stock‑tracking portfolio. Investors can add holdings quickly, organize multiple portfolios, and start analyzing performance in minutes — without the clutter or complexity found in many other tools.
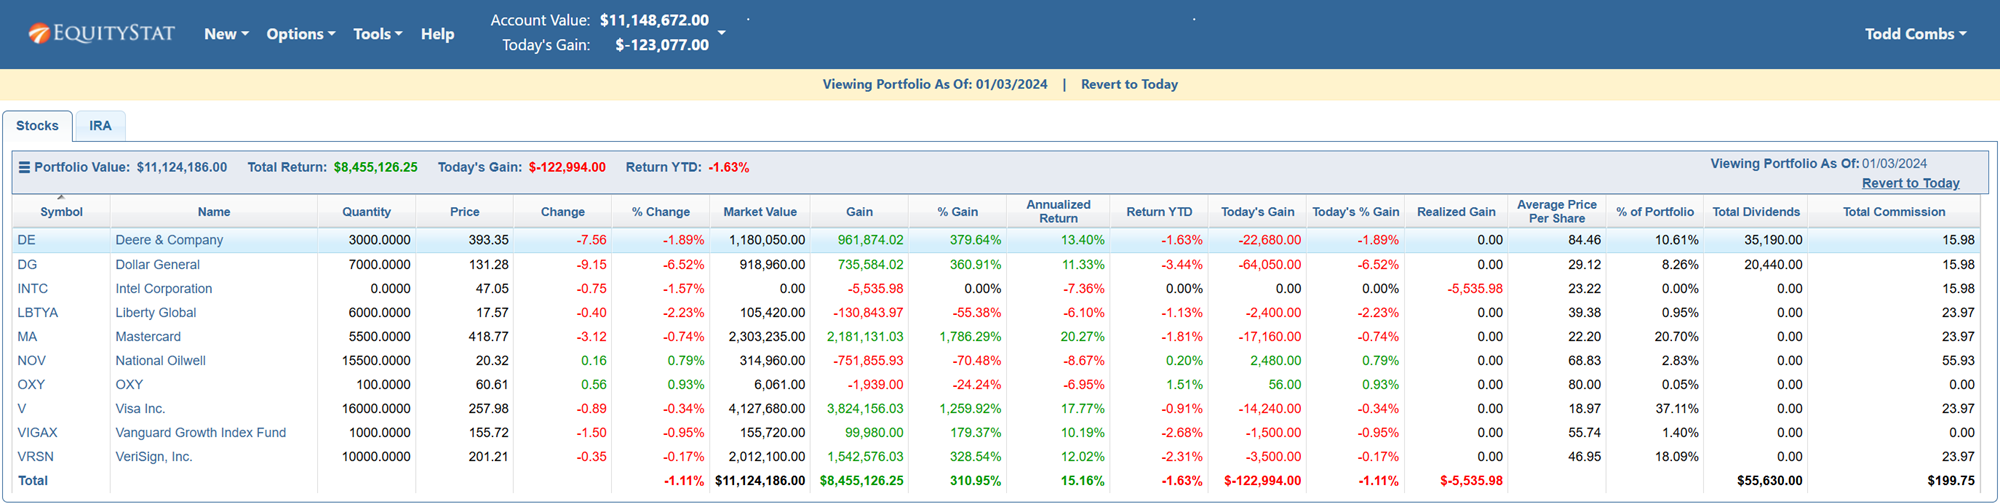
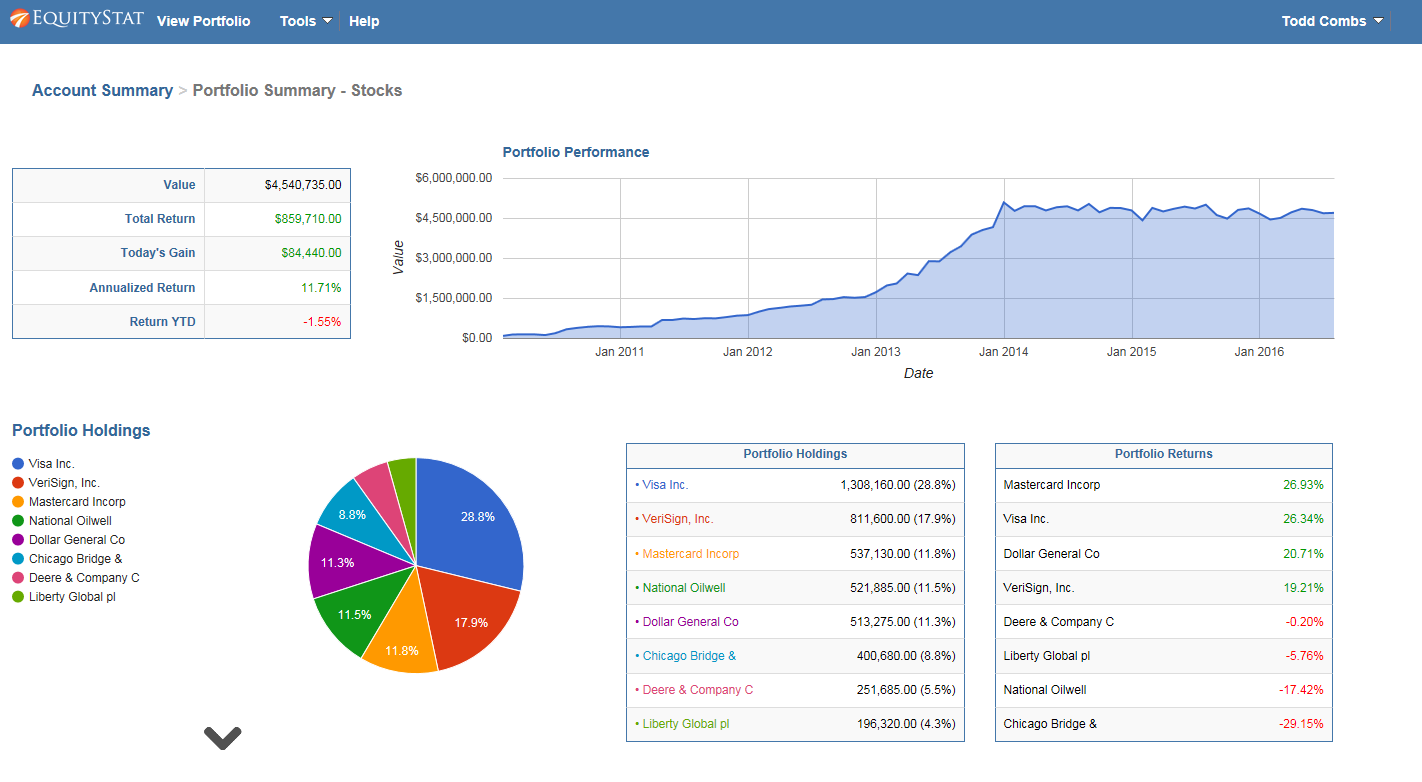
2. Robust Performance Metrics
According to Kiplinger’s analysis, EquityStat provides a wide range of performance indicators that help investors understand how their stocks, ETFs, and mutual funds are truly performing. These include:
- Daily gain/loss
- Total return
- Annualized return
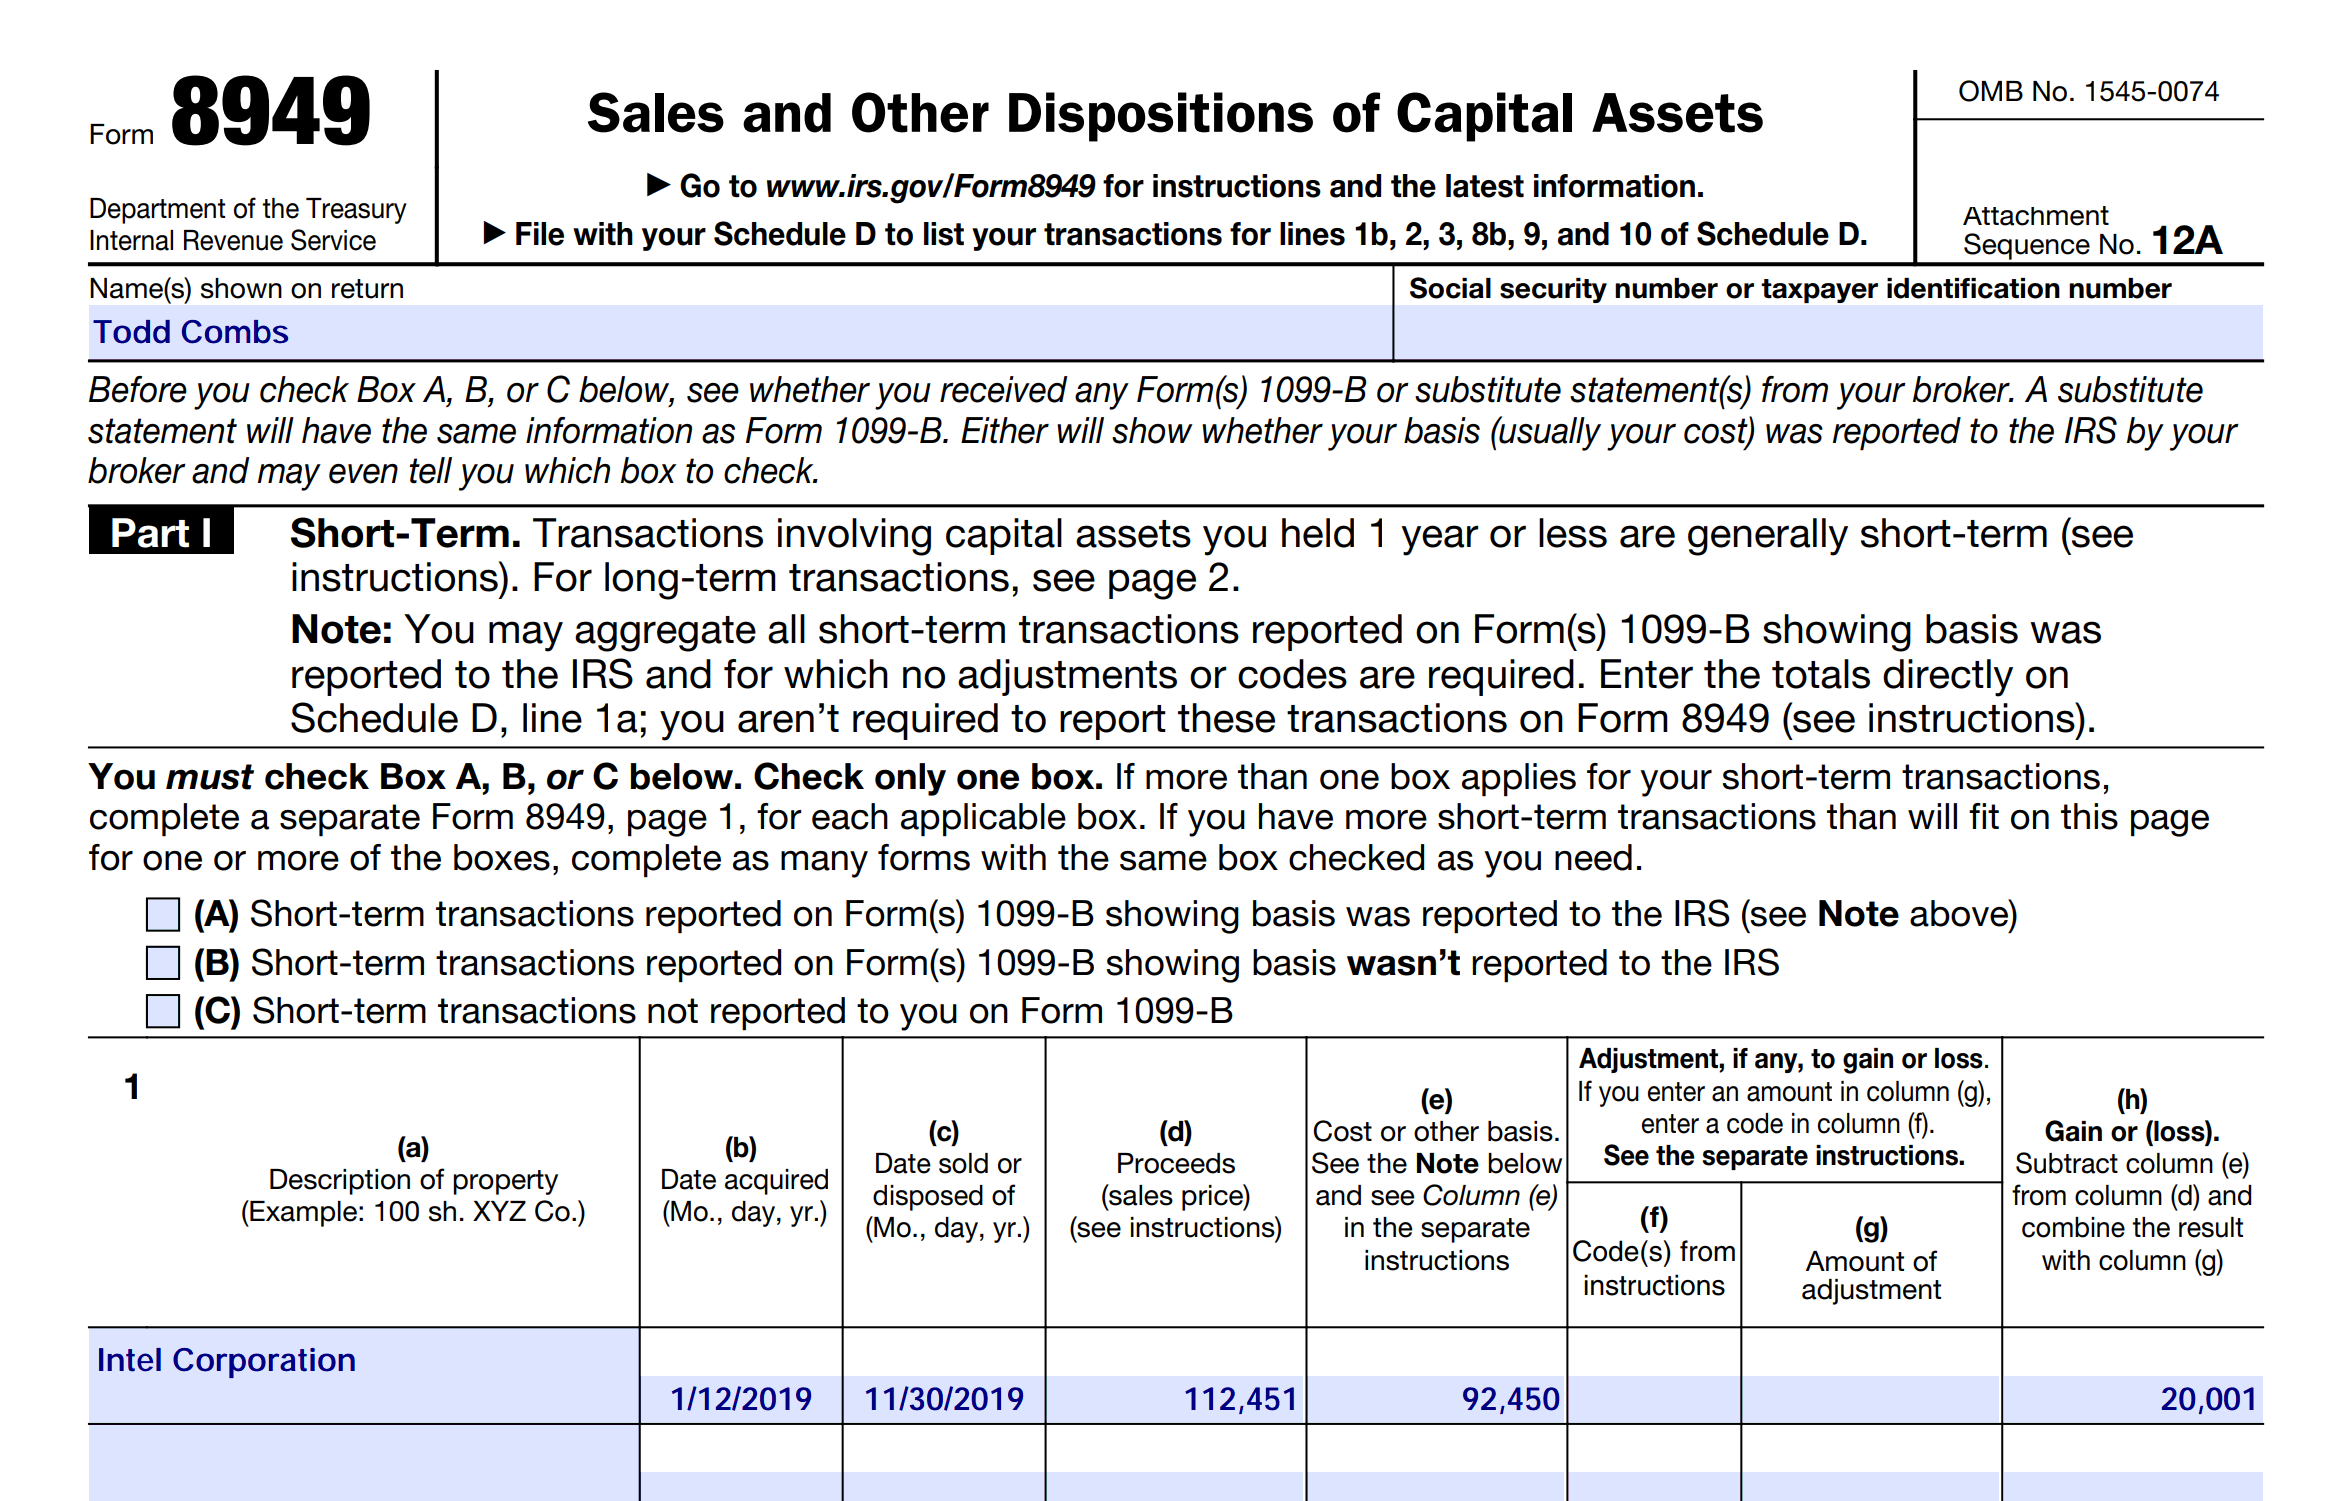
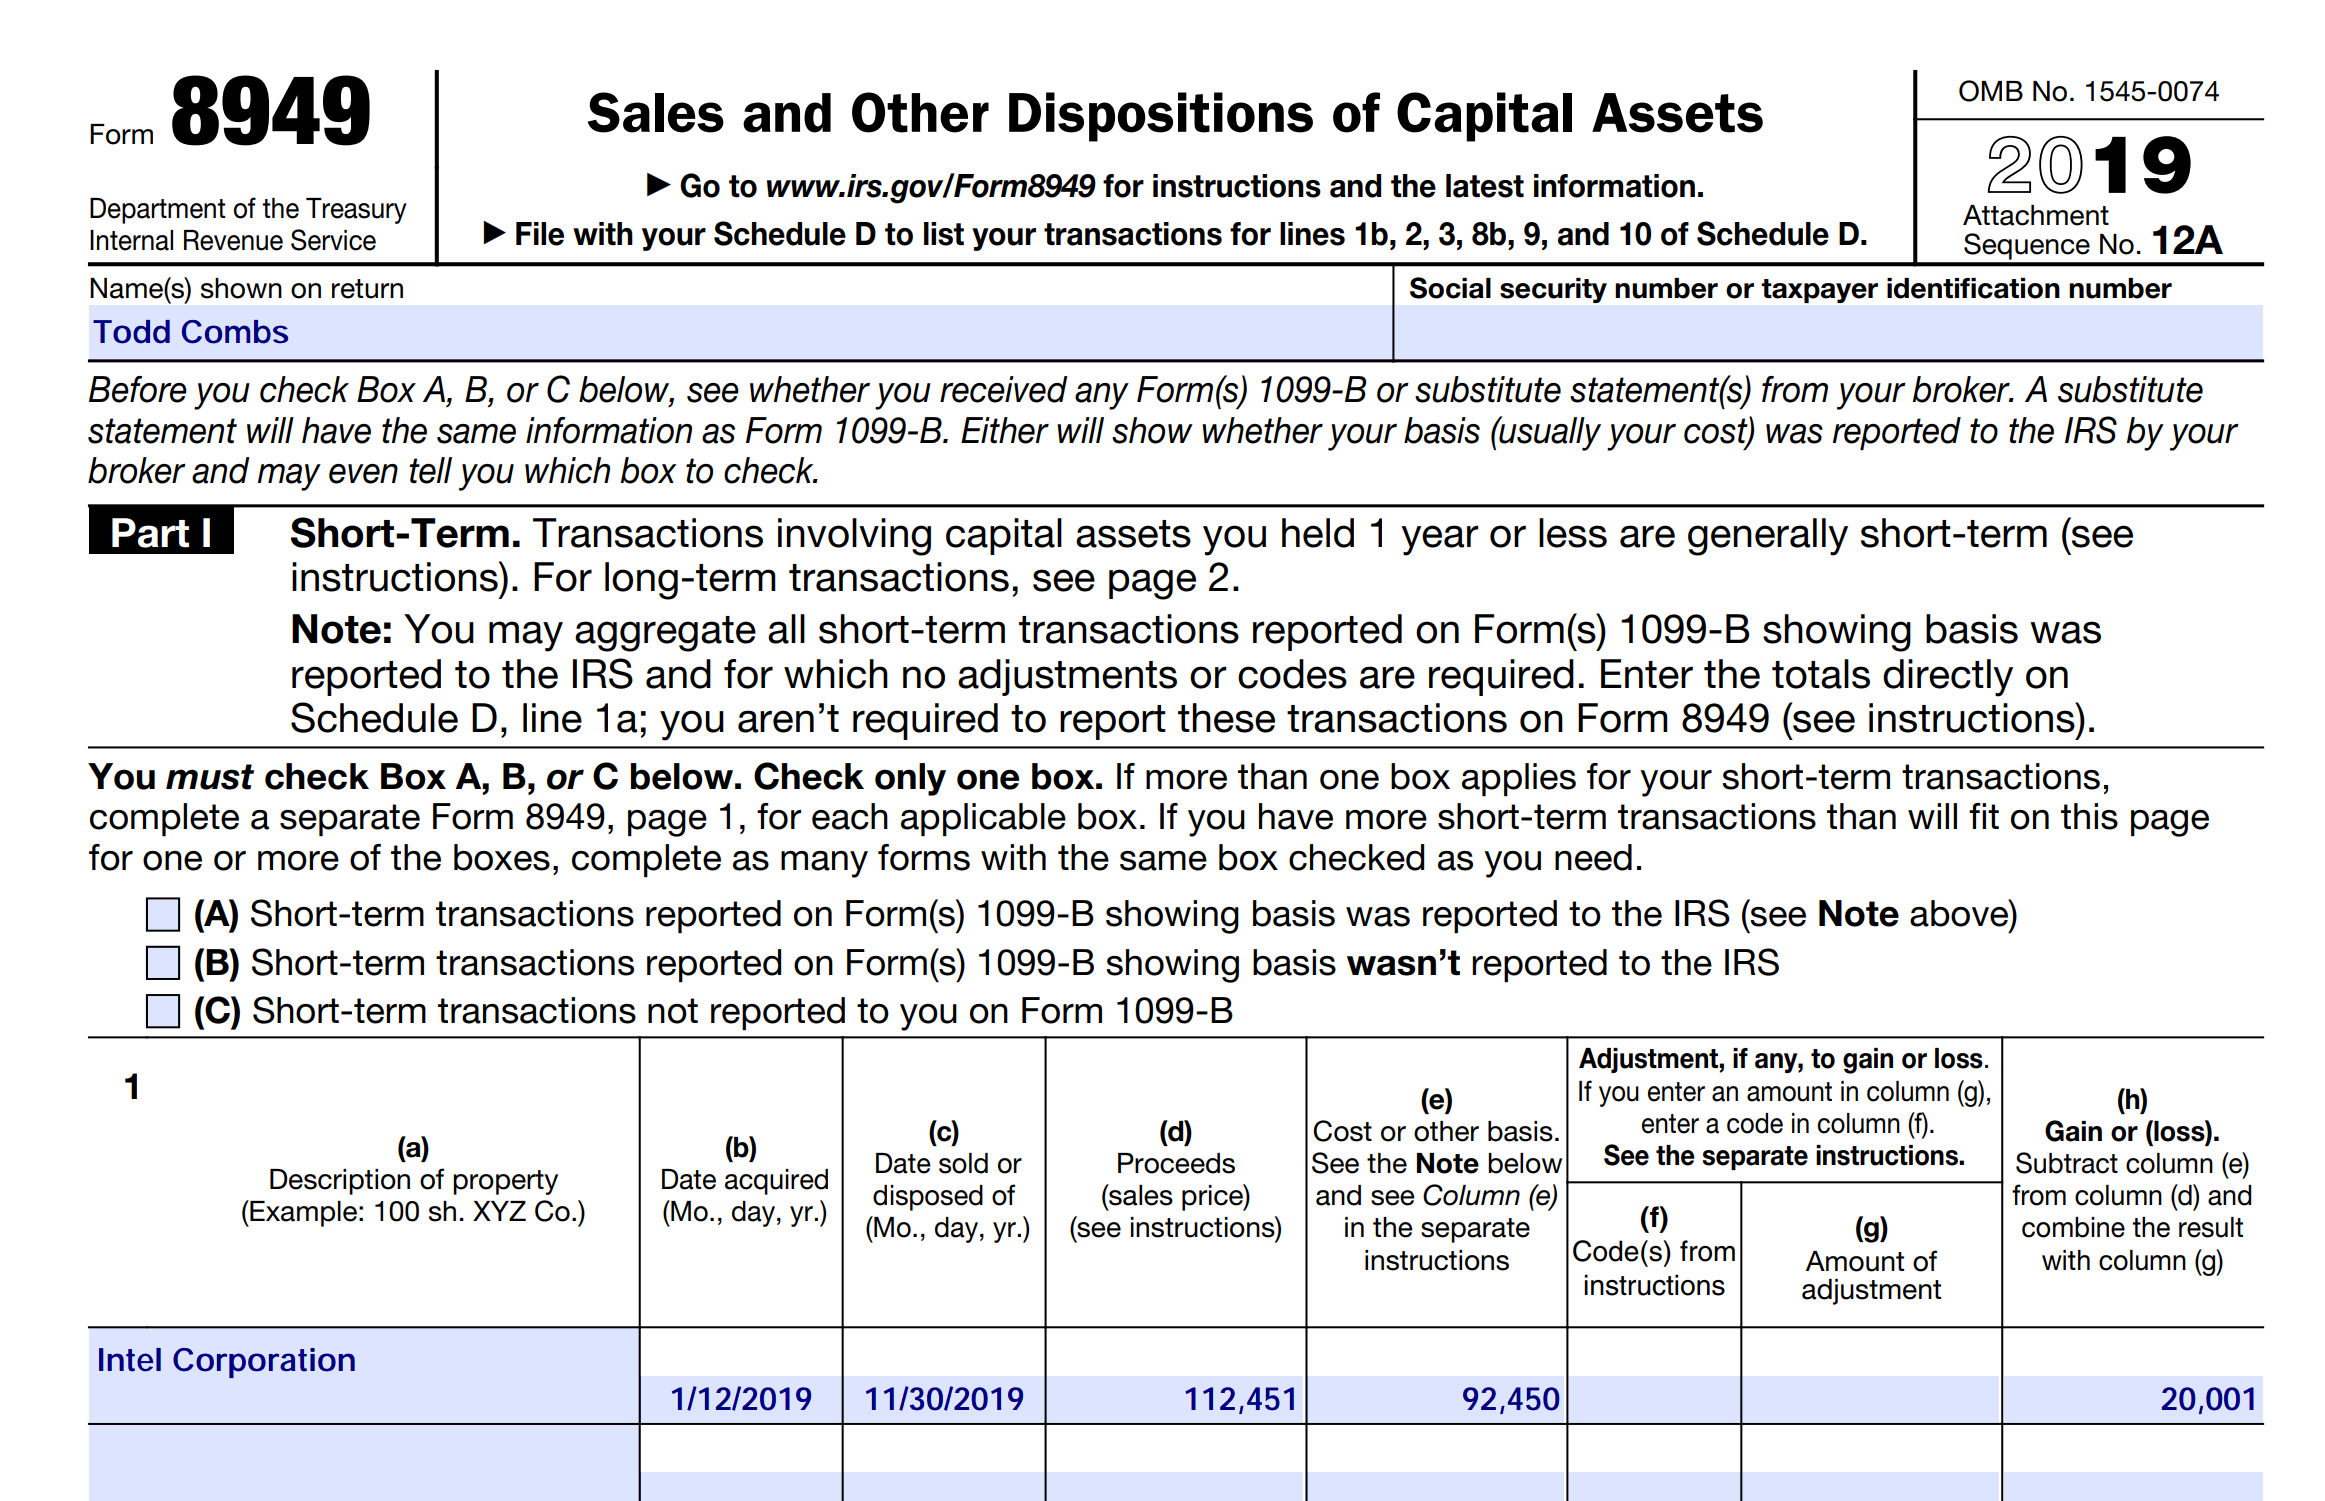
- Realized gains
- Cost basis
- Long‑term performance trends
These metrics give DIY investors the clarity they need to make informed decisions.
3. Clean, Intuitive Interface
Kiplinger also praised EquityStat’s clean, streamlined design. The interface avoids unnecessary distractions and focuses on what matters most: clear data, easy navigation, and fast access to performance insights.
Why This Recognition Matters
Being named one of Kiplinger’s top tools reinforces what many investors already know: EquityStat is a reliable, transparent, and user‑friendly platform for tracking investments.
For individual investors — especially those managing their own portfolios without an advisor — having a tool that is both powerful and easy to use is essential. Kiplinger’s endorsement highlights EquityStat’s ability to deliver exactly that.
You can read the article here.
https://www.kiplinger.com/investing/great-tools-for-diy-stock-investors