Setting up EquityStat takes just a few minutes, and once your first investment is entered, you’ll have a working stock portfolio tracker you can build on. This quick getting started guide walks through adding your first investment, understanding your portfolio view, entering additional transactions, and keeping your portfolio organized as your holdings change over time.
Add Your First Investment
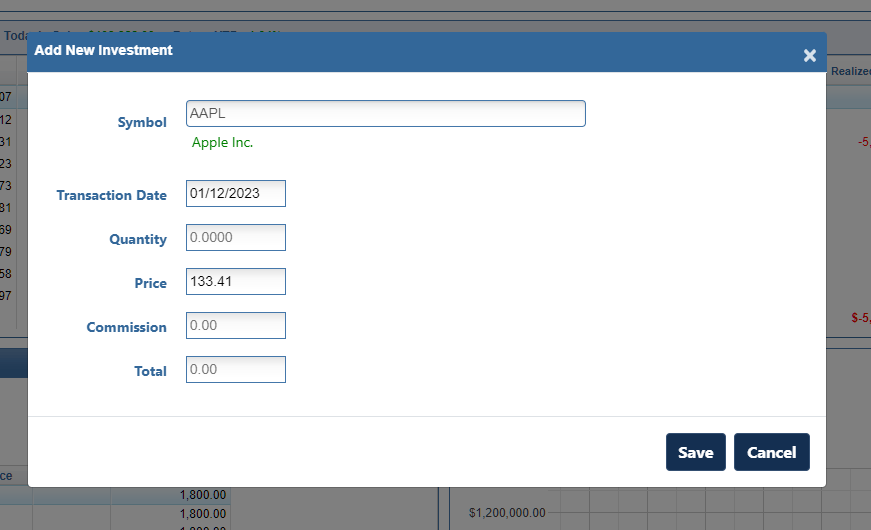
After you join EquityStat, you’ll be logged into your account. Since you won’t have any investments yet, you’ll see an empty portfolio screen. From here, click the New Investment button to add your first holding.
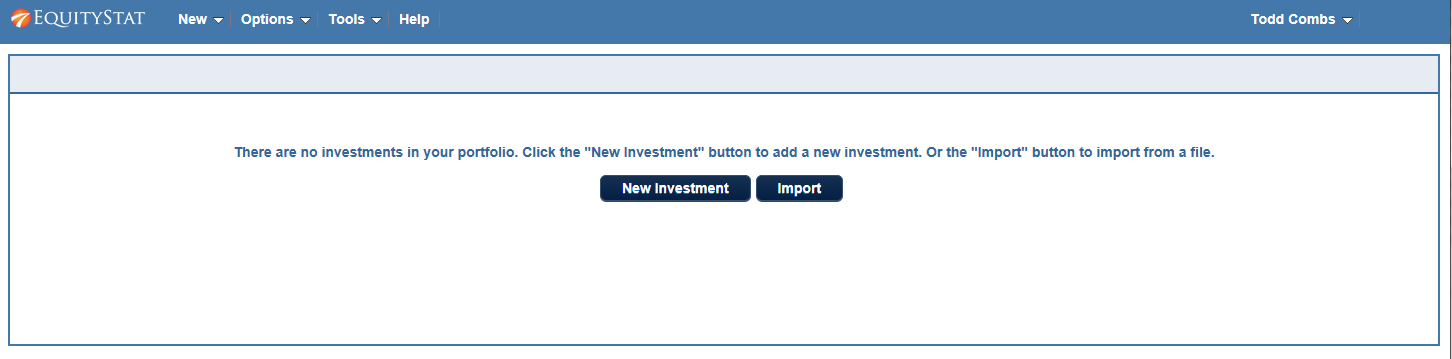
Add transactions to EquityStatClicking New Investment opens a dialog where you can enter a buy transaction. Enter the symbol of the investment, the date of purchase, the number of shares purchased, and the price per share, then click Save. Once your first purchase is entered, you can go on to add other transactions for that same investment, including additional buys, sells, and dividends.
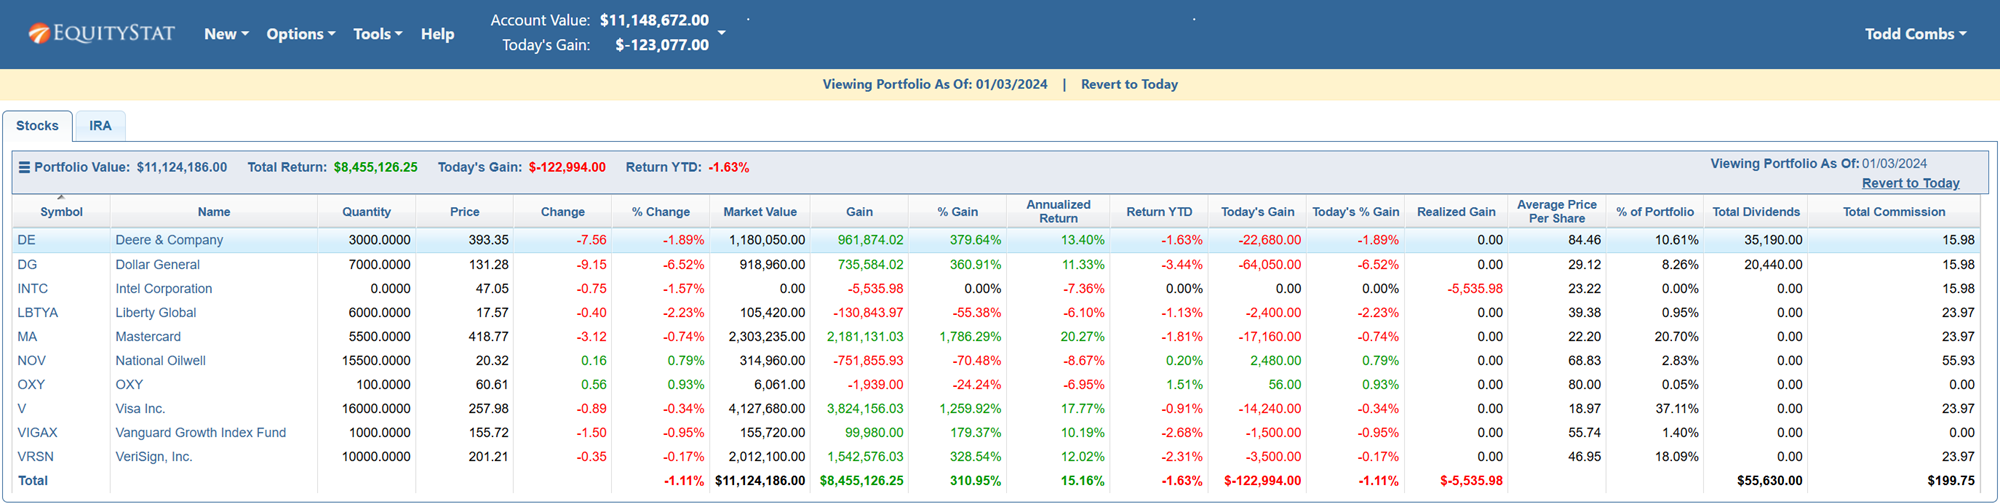
Understanding Your Portfolio View
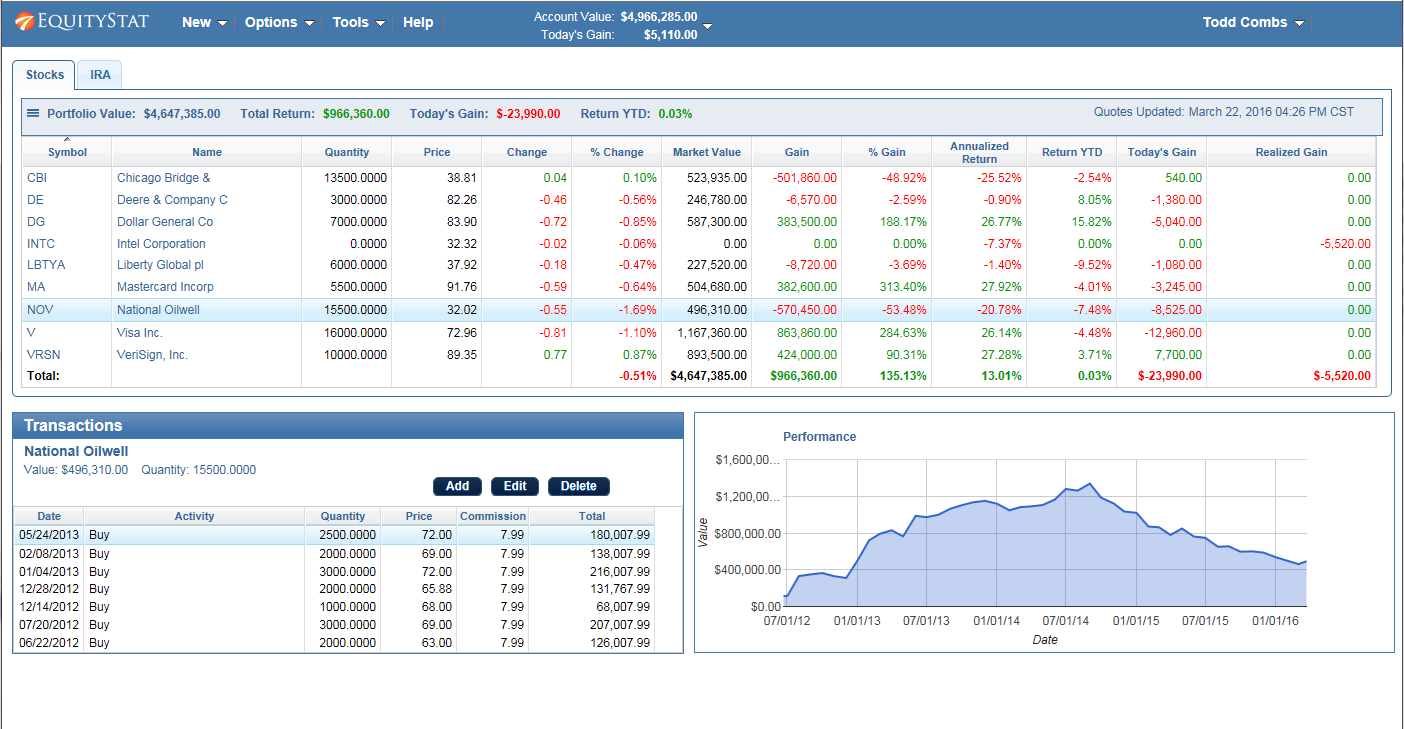
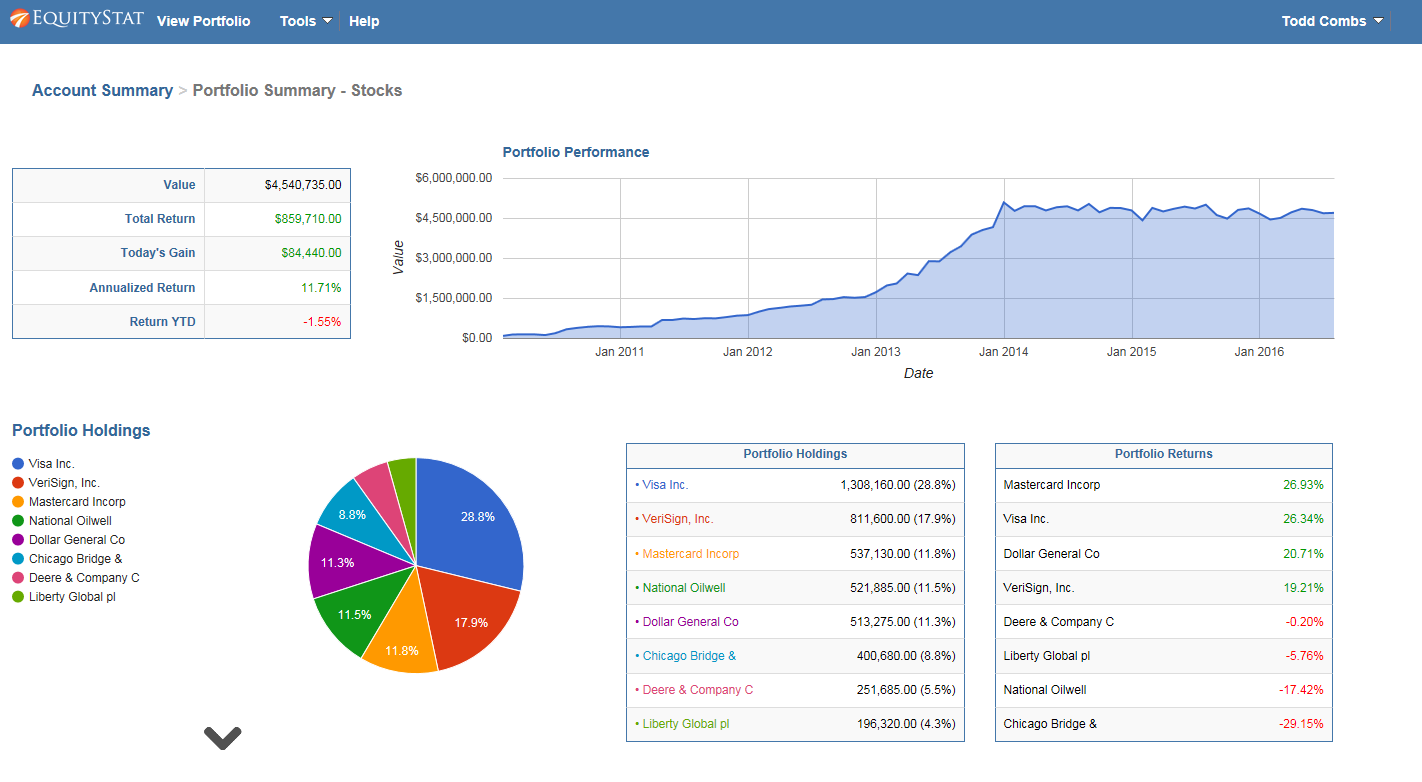
Once you’ve added a few investments, your portfolio view will look something like the example below.
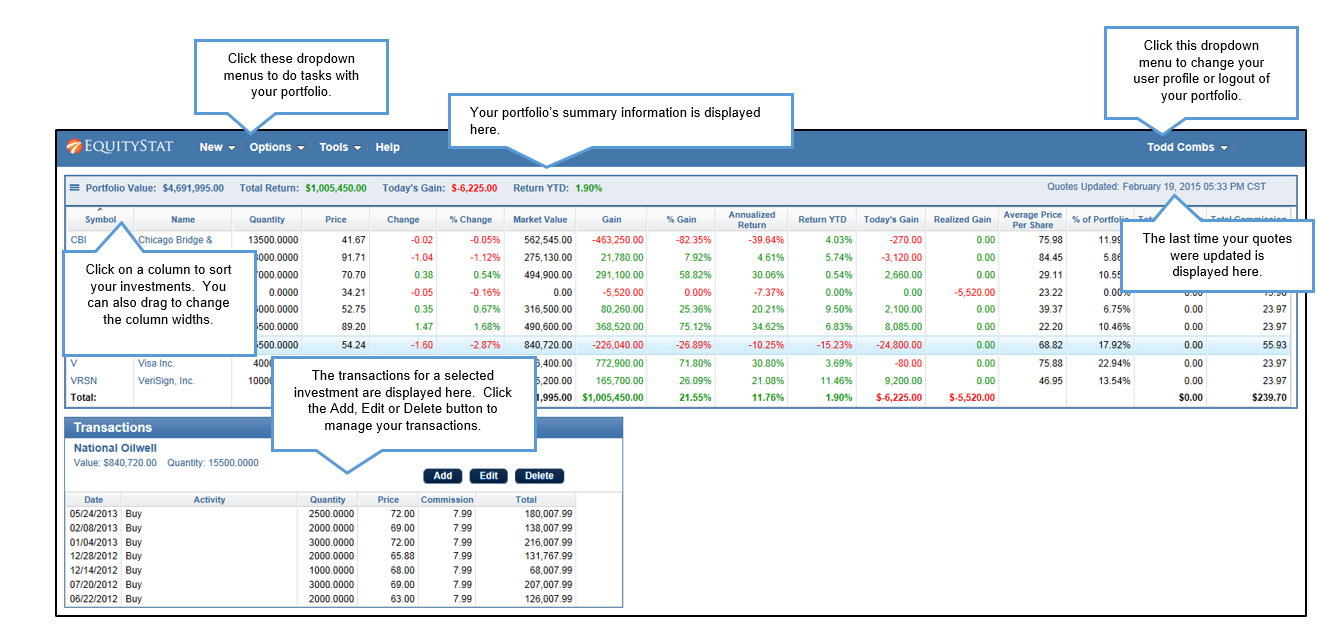
The top table lists all of your investments along with key performance metrics and data about each investment. Below it, you’ll see the transactions for whichever investment is currently selected. You can sort your investments and transactions by clicking any column heading, and you can widen a column by dragging its border. Above the investment table, a summary section shows your total portfolio value, total dollar return, day’s gain or loss, and year-to-date return, giving you an at-a-glance read on how your stock portfolio manager sees your overall performance.
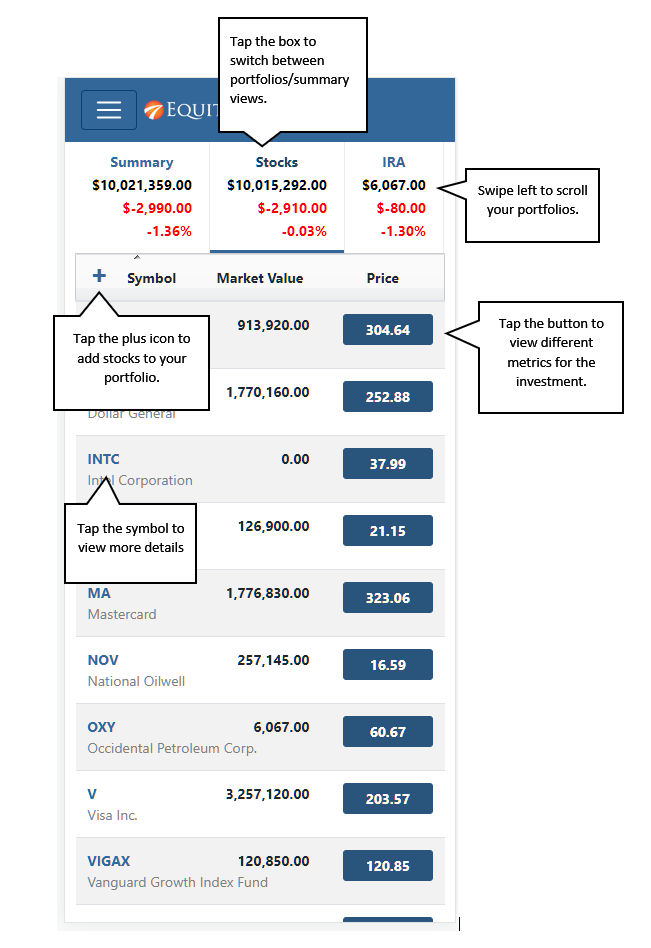
Adding More Investments
As your portfolio grows, you’ll need to log new investments and additional transactions.
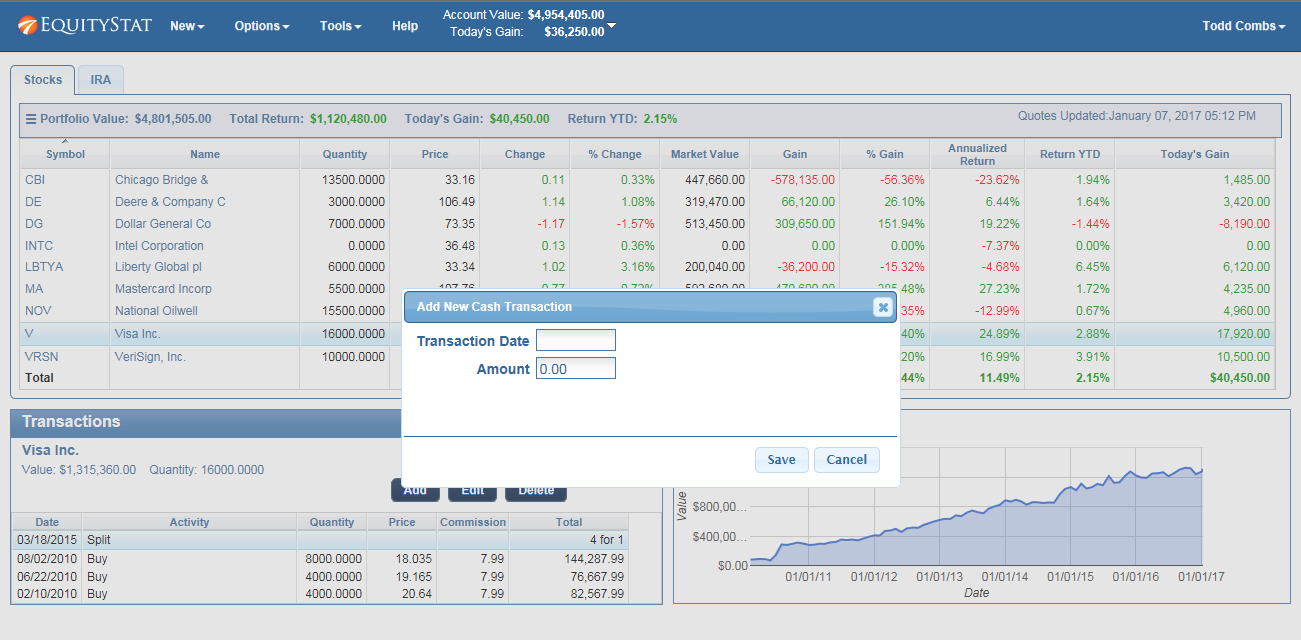
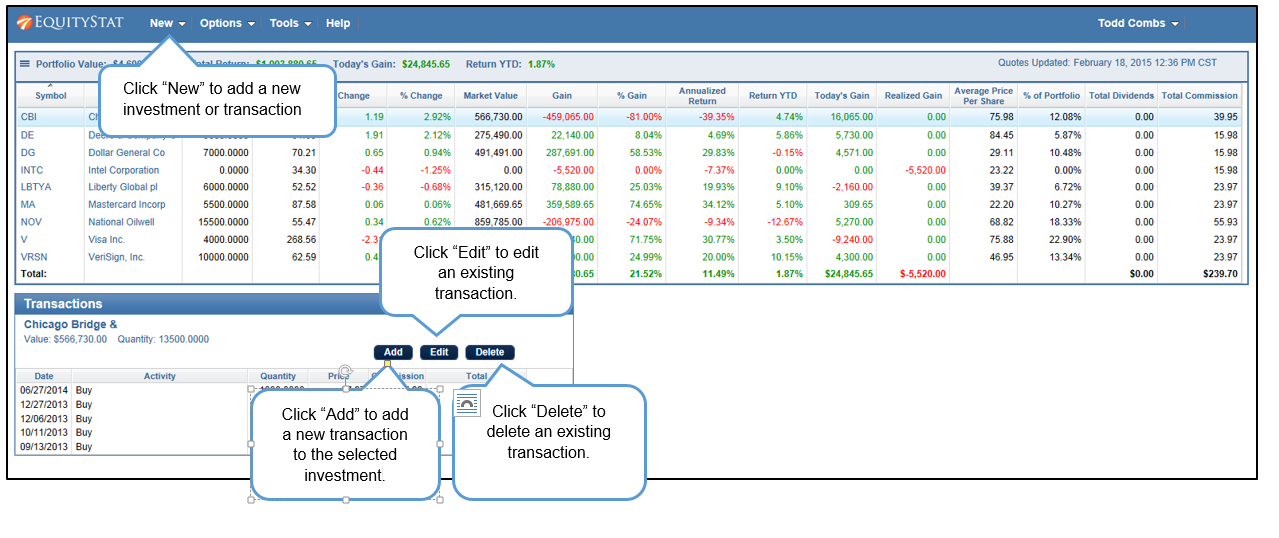
To add an investment that isn’t in your portfolio yet, click the New menu and choose New Investment. To add a transaction to an investment you already hold, go to the transaction table below the investment table and click Add. A new row appears where you can record a buy, sell, dividend, or one of several other transaction types. You can edit an existing transaction by selecting it and clicking Edit, or remove one entirely with the Delete button. If you’re moving a large number of trades in at once, it’s often faster toImport your transactions from a csv file into EquityStat instead of entering them one at a time.
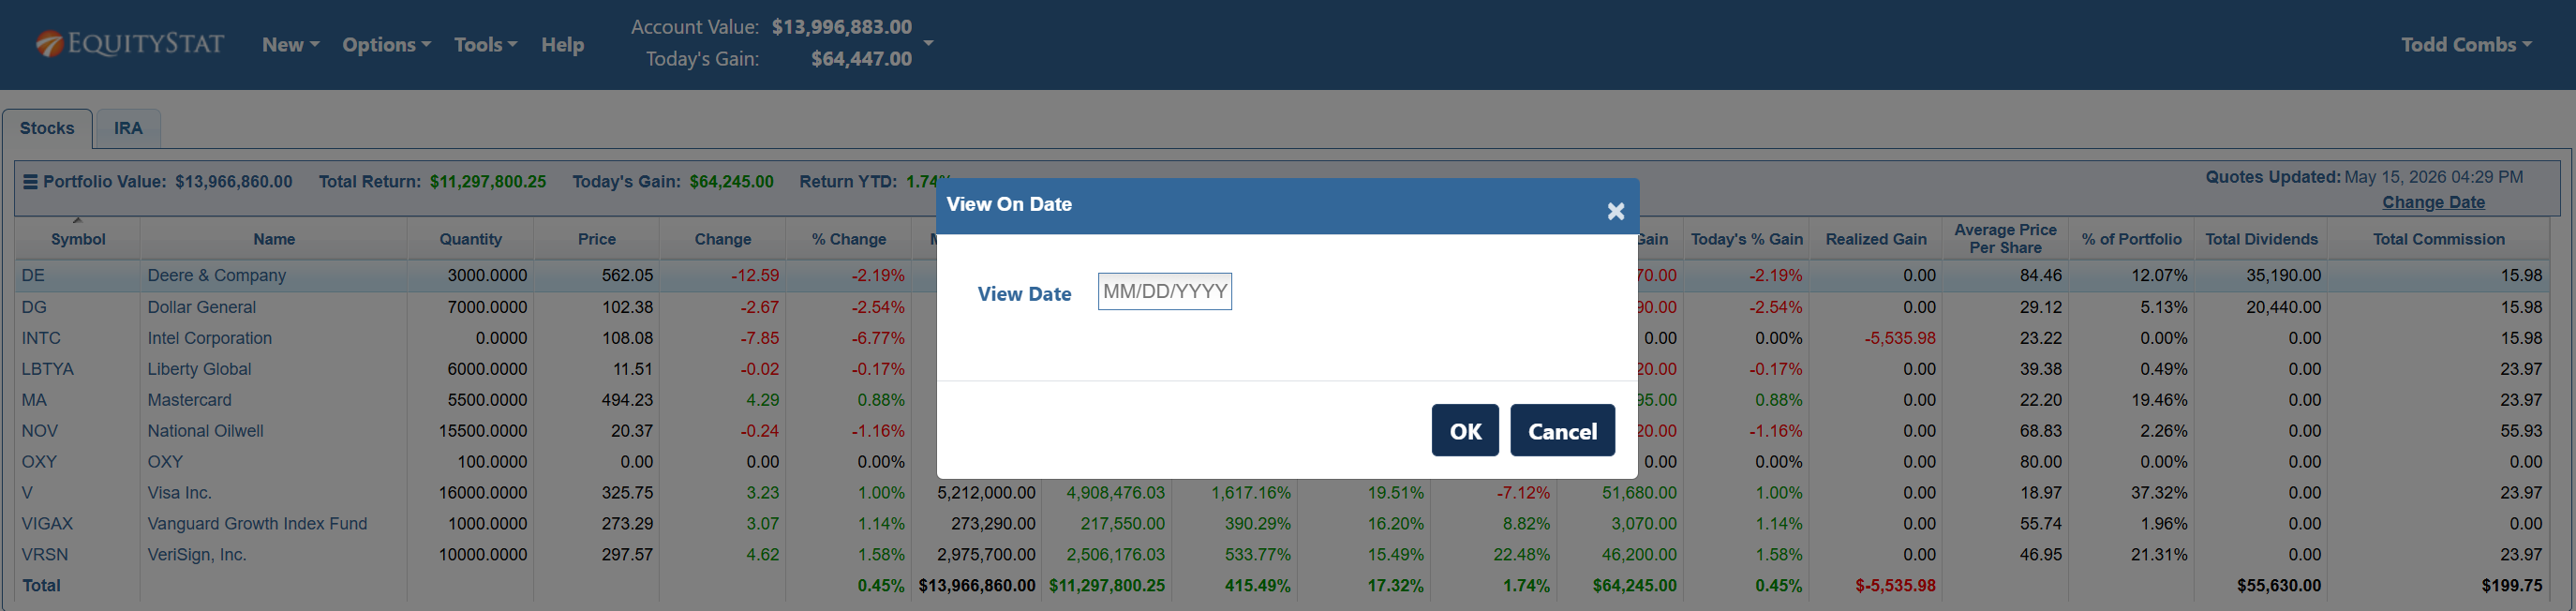
Hiding Sold Investments
Once you’ve sold out of a position entirely, you may not want it cluttering your active portfolio view.
Click the three-line icon on the left and choose Hide Sold Investments to remove fully sold holdings from view. To bring them back at any point, for example when you’re reviewing past performance, click the icon again and choose View Sold Investments.
Frequently Asked Questions
How long does it take to set up EquityStat? Adding your first investment takes less than a minute. A full portfolio with multiple holdings can typically be built out in under 15 minutes.
Can I import my existing transaction history instead of entering it manually? Yes. If you’re already tracking your investments elsewhere, you can import your transaction history from a Import your transactions into EquityStat rather than re-entering everything by hand.
What if I sell all of an investment, can I still see its history? Yes. Sold investments can be hidden from your active view to reduce clutter, but you can bring them back into view at any time to review their full history.