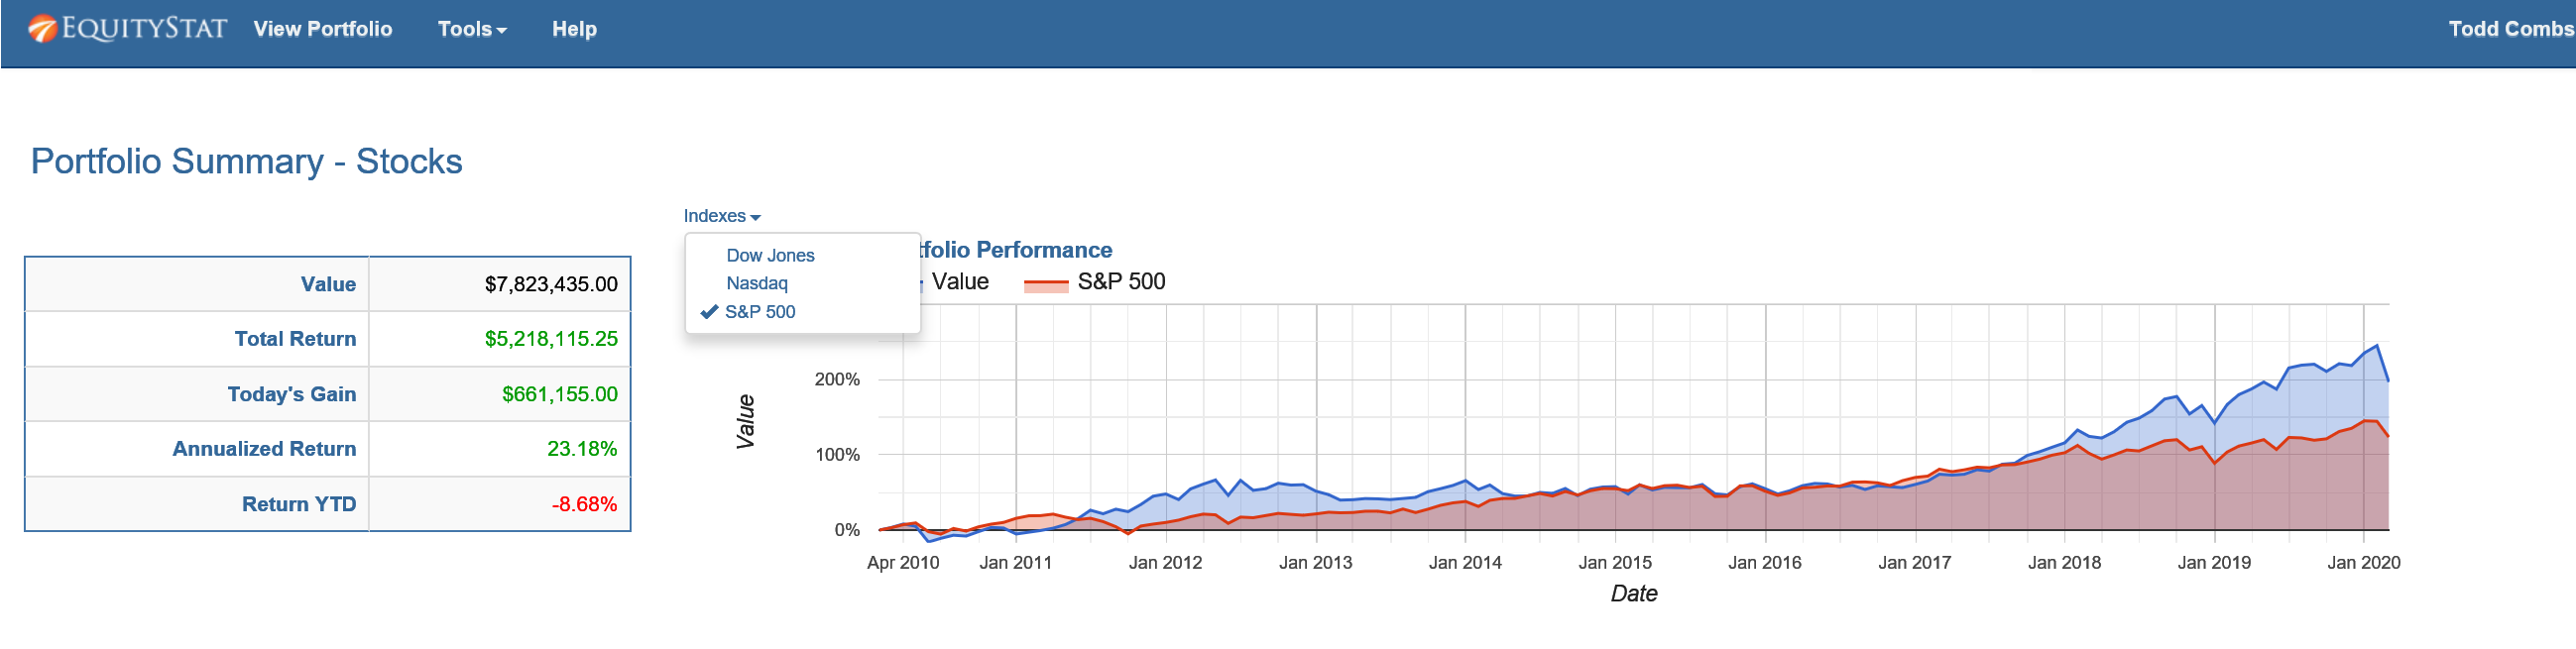
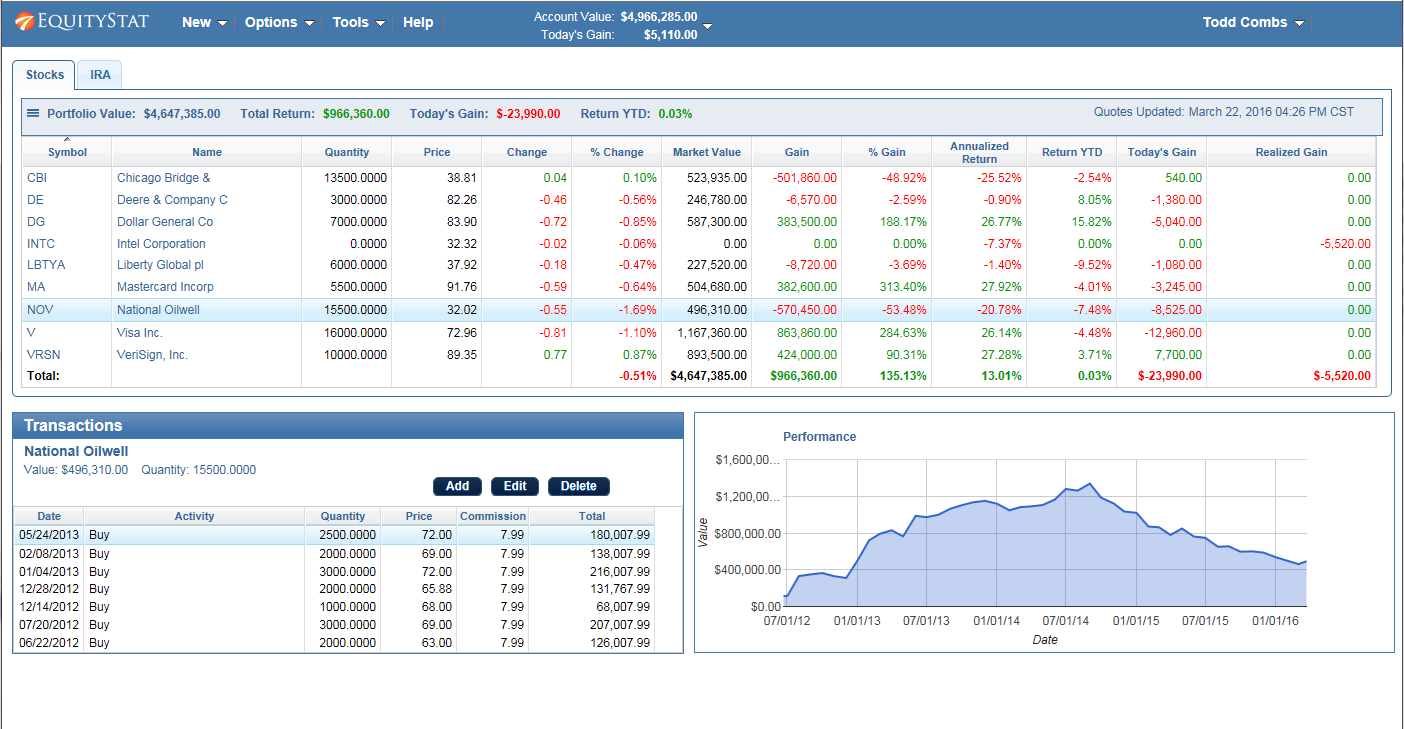
Investing is not just about tracking today’s numbers—it’s about understanding your portfolio’s journey over time. That’s why EquityStat, your all-in-one stock portfolio tracker, is excited to introduce a powerful new feature: View On Date. Now, you can look back at your holdings and portfolio performance on any past date, giving you deeper insight into your investment strategy.
Introducing “View On Date”
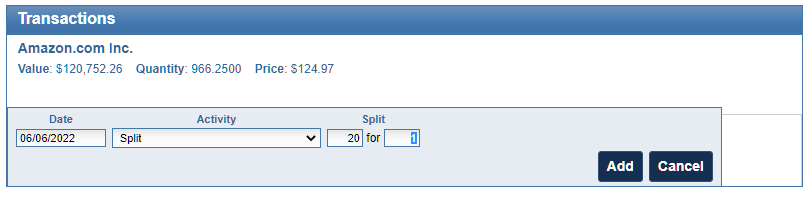
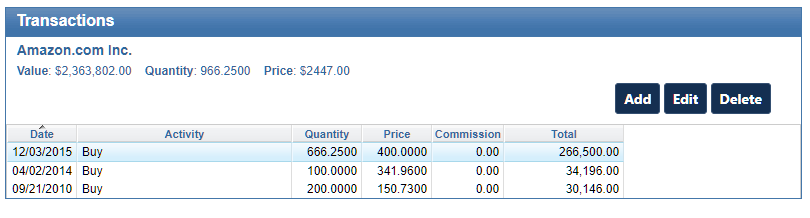
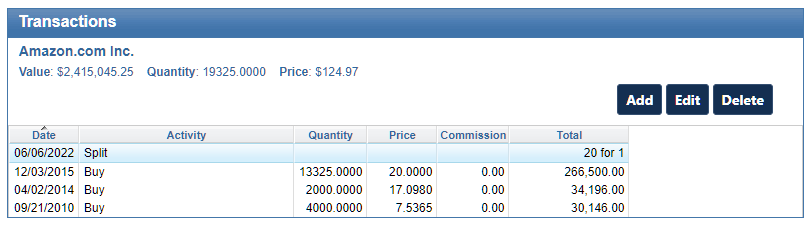
The View On Date feature allows you to examine your portfolio exactly as it appeared on a specific past date. When you select a past date:
- Only the investments you held on that date will be displayed.
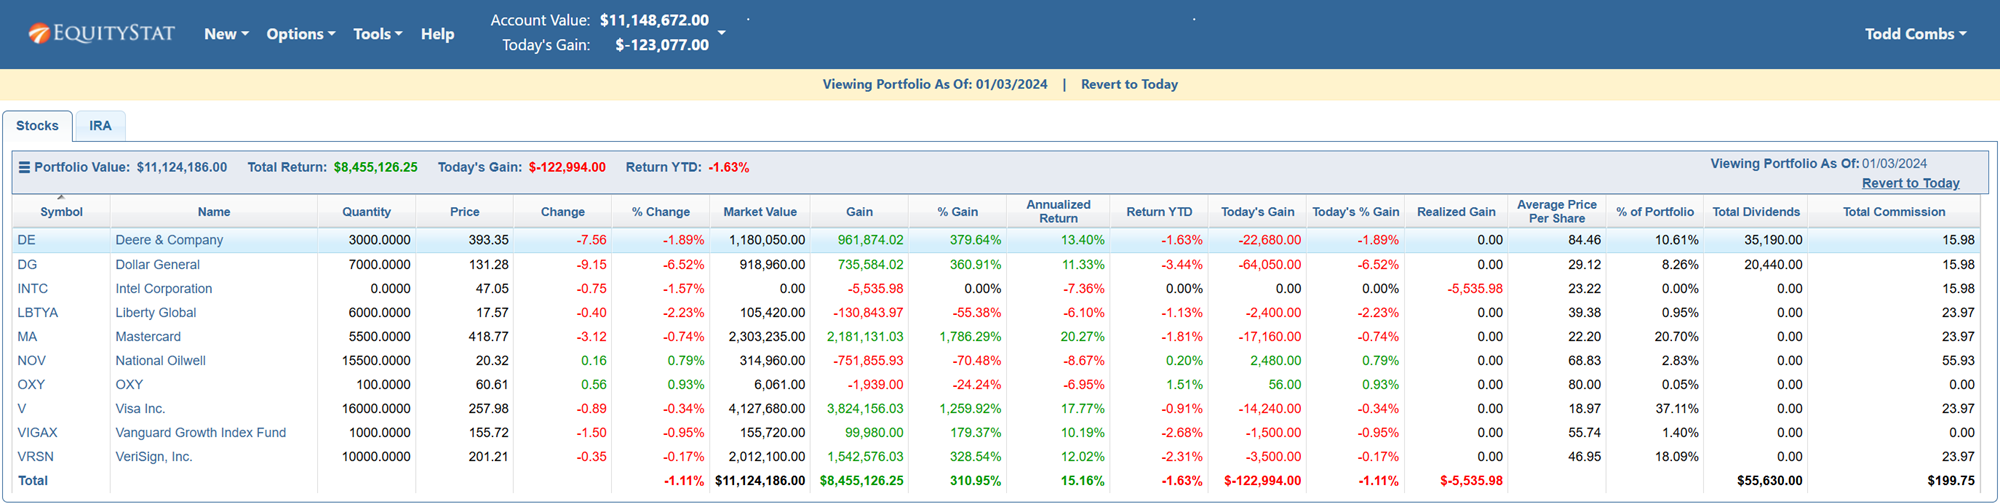
- Performance metrics are calculated using the closing prices from that date, giving you an accurate snapshot of your historical portfolio performance.
Whether you’re reviewing historical performance, analyzing past trades, or comparing growth over time, this tool gives you precise insight into your investment history.
How to Use “View On Date”
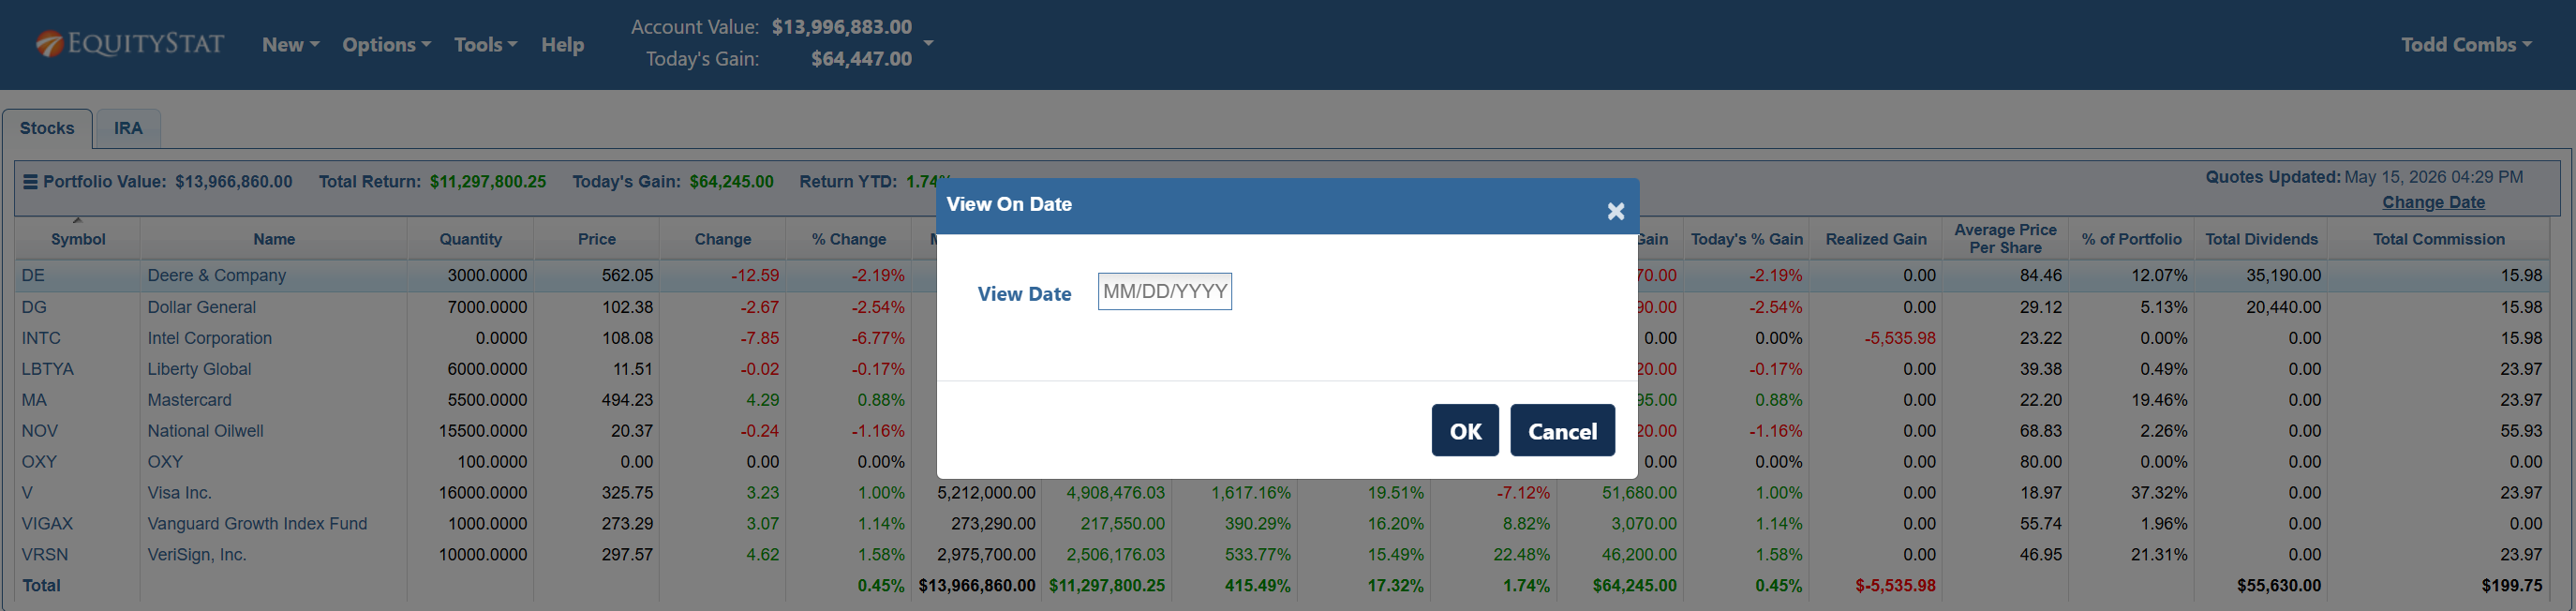
- Via the Options Menu:
- Click the Options menu at the top of your portfolio dashboard.
- Select View On Date from the dropdown.
- Enter the past date you want to review in the dialog box.
- Using the Change Date Link:
- Underneath the “Quotes Updated” date, click Change Date to select a past date.
- Underneath the “Quotes Updated” date, click Change Date to select a past date.
- Portfolio Analysis for Past Dates:
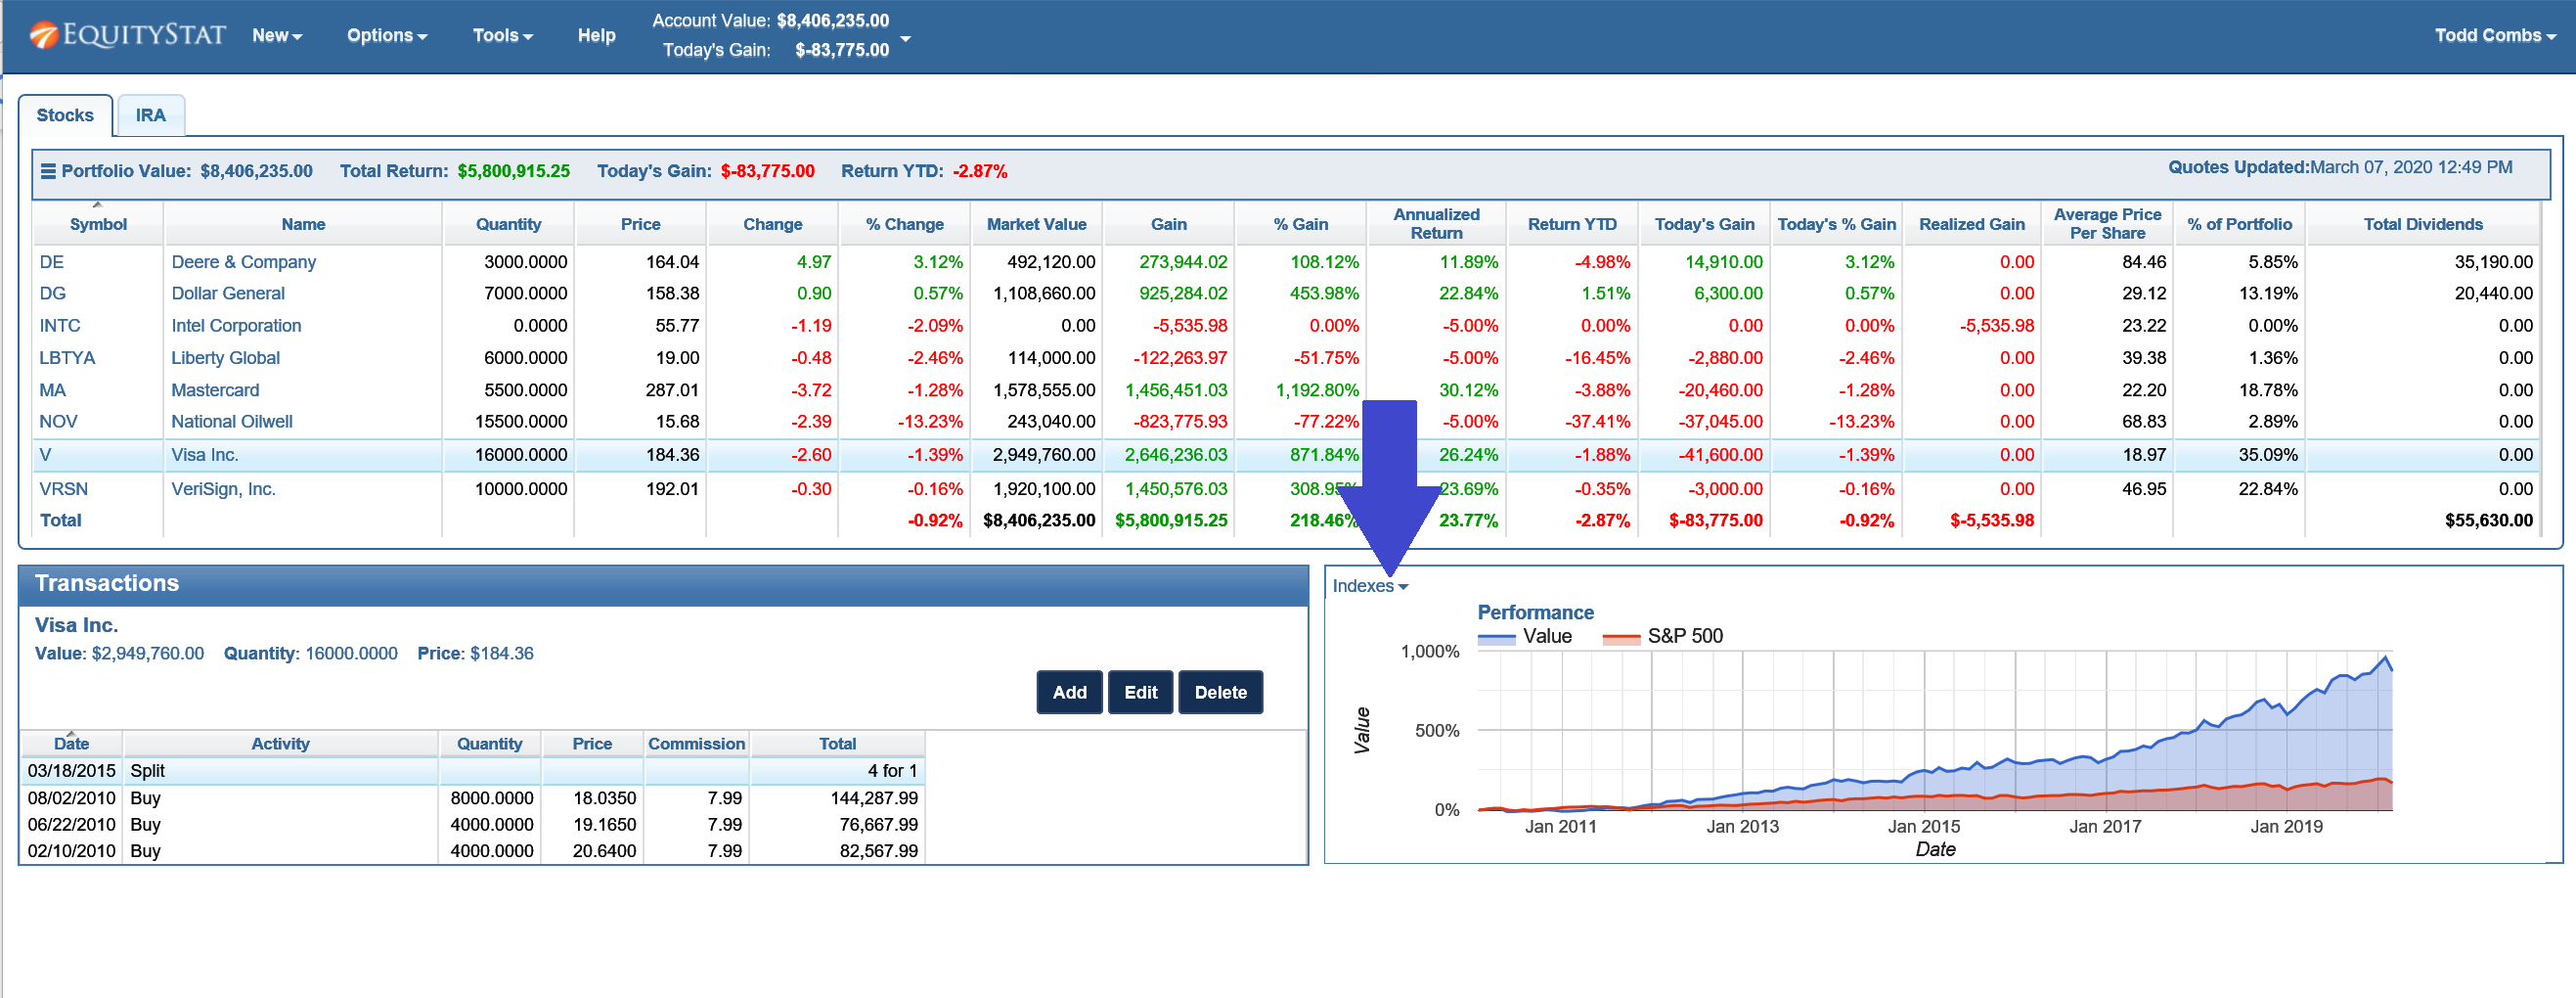
- In the upper right-hand corner of your portfolio dashboard, click the View On Date link to access historical portfolio analysis.
Once you’re viewing your portfolio on a past date, a banner message at the top of the page will show the date you’re analyzing. To return to your current holdings, simply click Revert To Today.
Why Investors Will Love This Feature
- Historical Insights: Understand how your portfolio has performed over weeks, months, or even years.
- Performance Analysis: Evaluate the impact of past decisions to refine your investment strategy.
- Simplified Tracking: No more manual tracking or spreadsheets—see past performance directly in EquityStat.
This feature makes EquityStat not just a real-time portfolio tracker, but a historical analysis tool that empowers investors to make smarter decisions.
Start Exploring Your Portfolio History Today
With EquityStat’s View On Date feature, you have complete control over your portfolio insights—past, present, and future. Stay informed, track your progress, and make confident investment decisions all from a single platform.