New Mobile Feature – Investment Symbol Search

We have recently added a new feature to the mobile device user interface. When adding a new investment to your portfolio, you can easily lookup the investment to add. In the past when you added an investment to your portfolio, you needed to know the investment symbol. Now, in the Symbol field you can start typing, which will display all symbols and investment names that matches the text as you type. With this new feature the mobile phone user interface works similar to the desktop user interface.
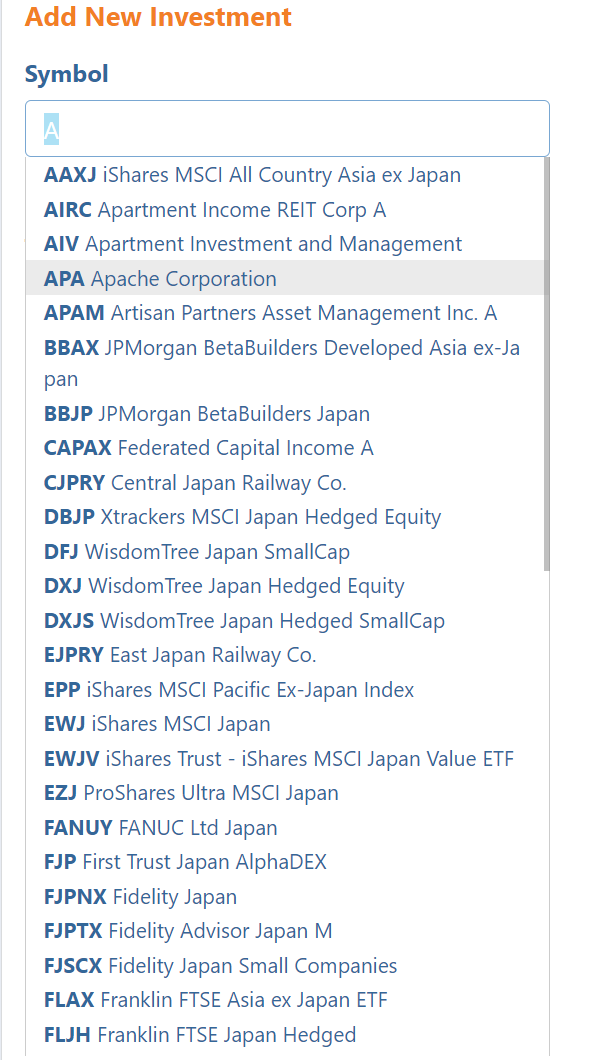
Lookup a symbol when adding a new investment to your EquityStat stock portfolio on a mobile device.
Example of the new symbol lookup when adding a new investment on a mobile device.

For example, as seen in the screen shot above, if you start typing “A” in the symbol field you will get a list of symbols and investments that match this text. This will make finding your investment symbol much easier.

To choose a symbol, select the line that has the investment you want to add to your portfolio.

If you don’t find your symbol listed, just type in the symbol and tab to the next field. The symbol will then be checked to make sure it is a valid symbol. If it is not a valid symbol for an investment, you will get an “Invalid Symbol” message.
New Feature – Share Your Portfolio

Have you ever wanted to display what stocks you own on a webpage? Or maybe you want to show what stocks you recommend on an online investment forum?  What about sharing your stock portfolio on X, Facebook or email?

With our new Share Portfolio feature you can do all of this.  

To get started sharing your portfolio, click the Tools menu at the top and choose Share Portfolio from the drop down menu.

On the Share Portfolio page, choose the portfolio you want to share and click the Generate button. An image of your portfolio will then be generated. You can then link to this image on a website or social media post. You can also download the image and send the image in an email or also use the image file in a social media post.

For example, here is an image of a portfolio for Berkshire Hathaway’s top stocks.

If you link to an image, the image will display the most recent prices for the stocks in your portfolio. If you share the image file, the prices will be the current price when the image was generated.

You can also choose what columns to display in the image by clicking the Select Columns link and then choosing the columns you want to display.

New Feature in EquityStat’s Stock Portfolio Tracker

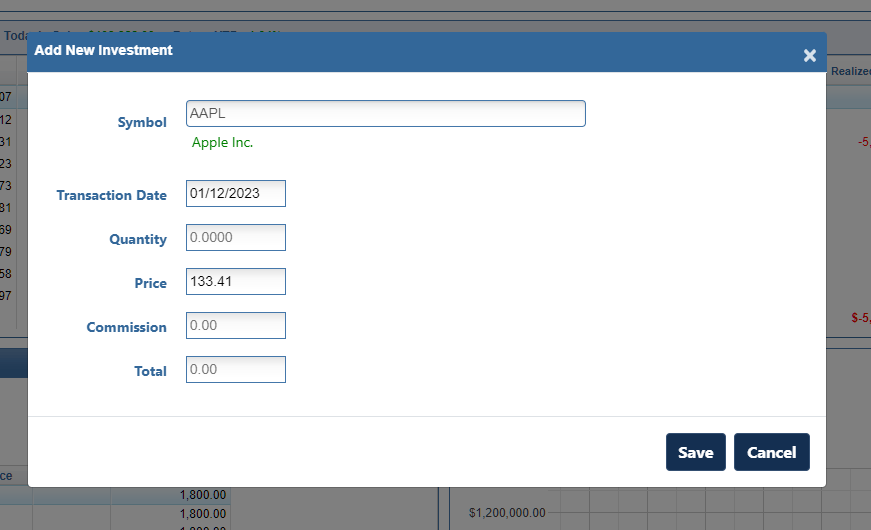
We have added a new feature to our Stock Portfolio Tracker application. When you enter a new stock/investment or add a new transaction for an existing stock/investment, the price of the investment is automatically displayed in the Price field. The price that is displayed is the closing or current price for the date of the transaction. If this price is not correct, you can override the price by entering the correct price.

This feature was designed in case you don’t know the exact price you purchased or sold a stock for, the price is automatically filled in for you and you don’t have to look it up. If you do know the exact price, you can override the filled in price with the correct price.

EquityStat Stock Portfolio Tracker New Feature - Auto Price
Example of Auto Price

For example, if your purchased Apple stock on January 12, 2023 the price of $134.56 will automatically be filled in since this was the closing price on January 12th. If you purchased Apple for a lower or higher price, you can edit the price to the correct price.

This feature also comes in handy when you want to see what price a stock was trading for a past date. Just select the stock, enter the date and you will see the price for that date.

New Feature – Investment Symbol Search

We have recently added a new feature. When adding a new investment to your portfolio, you can easily lookup the investment to add. In the past when you added an investment to your portfolio, you needed to know the investment symbol. Now, in the Symbol field you can start typing, which will display all symbols and investment names that matches the text as you type.

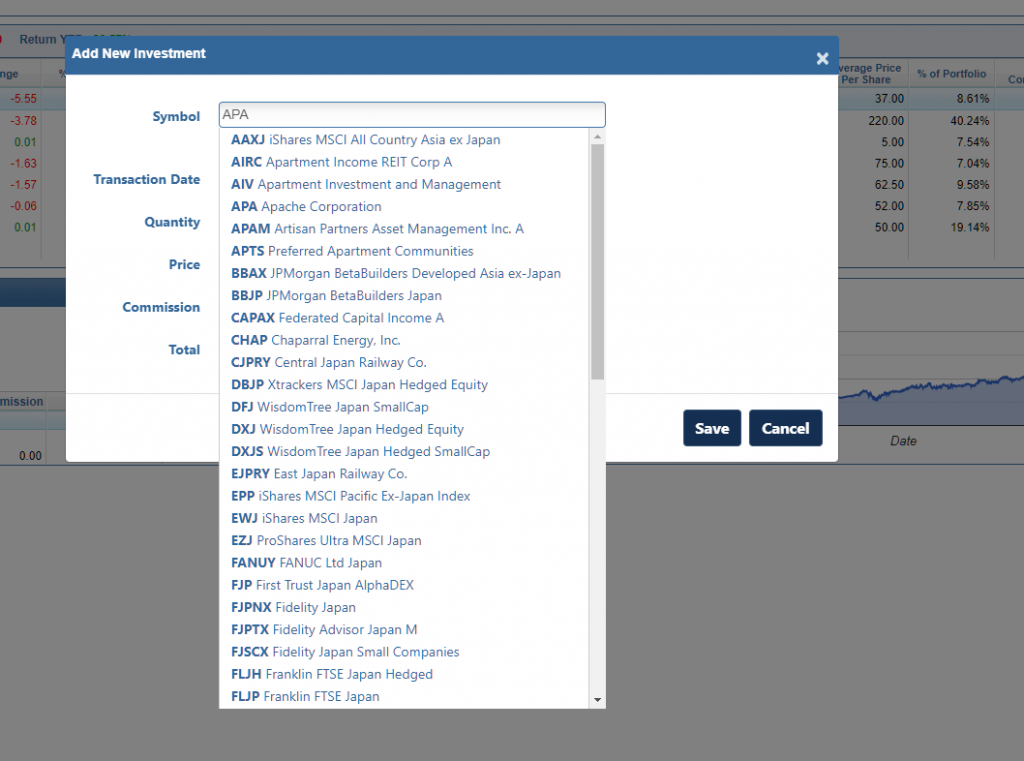
Lookup a symbol when adding a new investment to your EquityStat stock portfolio.
Example of the new symbol lookup when adding a new investment

For example, as seen in the screen shot above, if you start typing “APA” in the symbol field you will get a list of symbols and investments that match this text. This will make finding your investment symbol much easier.

To choose a symbol, select the line that has the investment you want to add to your portfolio.

If you don’t find your symbol listed, just type in the symbol and tab to the next field. The symbol will then be checked to make sure it is a valid symbol. If it is not a valid symbol for an investment, you will get an “Invalid Symbol” message.
EquityStat User Interface Changes

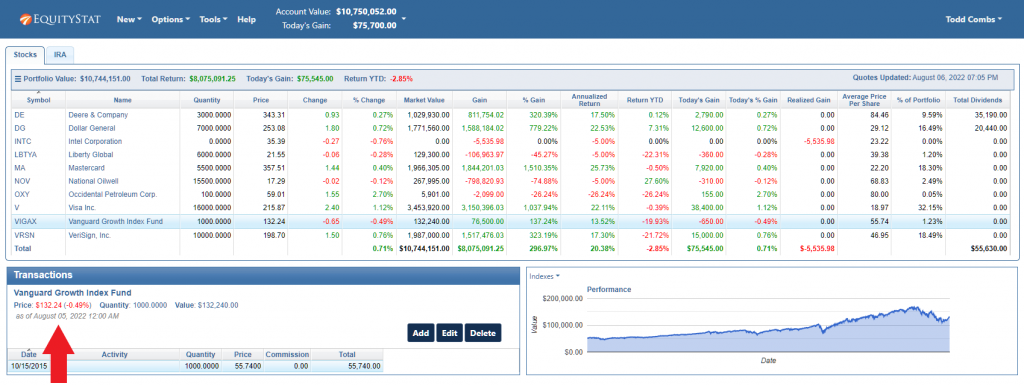
In the transaction panel, we now display the date the mutual fund price was last updated. Mutual fund prices are updated after market close. When viewing the price, you don’t know if the price is from the previous day or it is the current price. So, for mutual funds we have added the date the price was updated. This way you can know if the price is the current price or the price from the previous day.

EquityStat Mutual Fund Price Date

We have also added the percent change for the price for all investments and display the price in green if the price is up and red if the price is down.

Also, you can click on the name of the investment to view additional information about the investment on MSN Money.

Feature Highlight – Compare Your Investment Performance to the Dow Jones, the Nasdaq or the S&P 500 Index

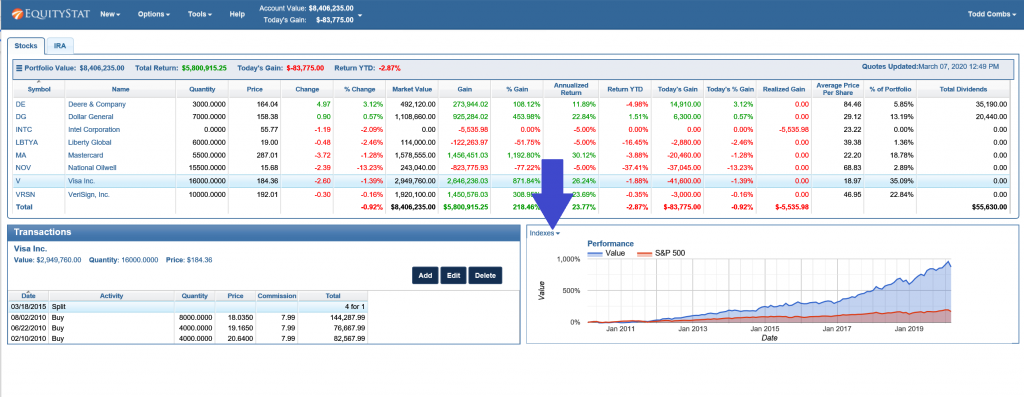
If you want to see how your investment performance is doing compared to an index, you can easily add an index to your investment’s performance graph.

To do this, select the index you want to compare, by clicking on the Indexes drop down menu link in the upper left hand corner of the performance graph.

Compare Stock Performance to Indexes
Compare Investment Performance to Indexes

When you click on the Indexes drop down menu link, you can choose from a list of indexes.

Choose to compare your stock's performance to the Dow Jones index, the Nasdaq index or the S&P 500 index
Choose to compare your stock’s performance to the Dow Jones index, the Nasdaq index or the S&P 500 index

Choose the Dow Jones index, the Nasdaq index or the S&P 500 index. You can choose one index or multiple indexes. When you choose an index, you will see a checkbox next to the index.

Once an index is chosen, you will see the index in your performance graph and how it compares to your investment’s performance.

To remove an index, click on the Indexes drop down link and select the index again. This will remove the checkbox from the index menu item and remove the index from your performance graph.

You can also compare your account/portfolio performance to an index. To do this, go to the Portfolio Analysis page by choosing the Tools menu at the top and selecting Analyze Portfolio from the drop down menu. From the Portfolio Analysis page, click the Indexes link above the performance graph and choose the index or indexes you want to compare.

Choose to compare your account/portfolio performance to the Dow Jones index, the Nasdaq index or the S&P 500 index

New Feature – Cash Transactions

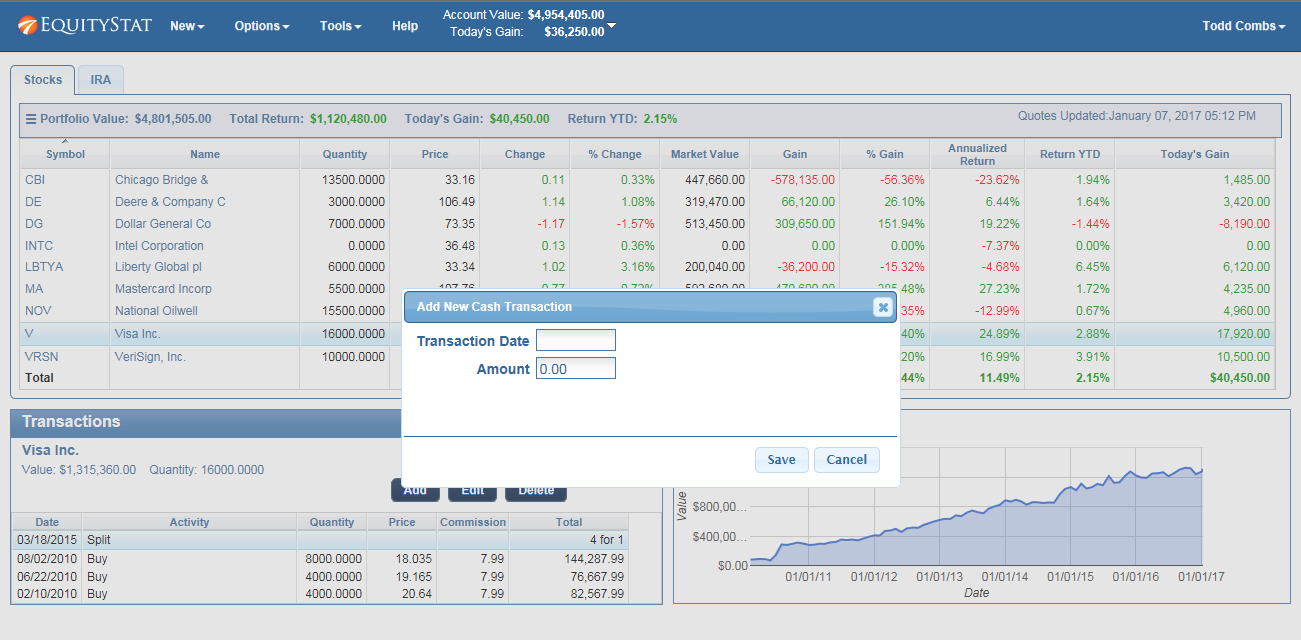
We have recently added a new feature.   You can now add cash transactions to your portfolio.  To add a cash transaction, click the New menu and then choose the “New Cash Transaction” menuitem from the drop down menu.  In the popup dialog, add the date of the cash transaction and the amount of the transaction.

Add Cash to Your EquityStat Portfolio
Add Cash To Your Investment Portfolio

Once you have added a cash transaction, any non-reinvested dividends added to your other investments will be added to your cash.

Portfolio Analysis – New Feature

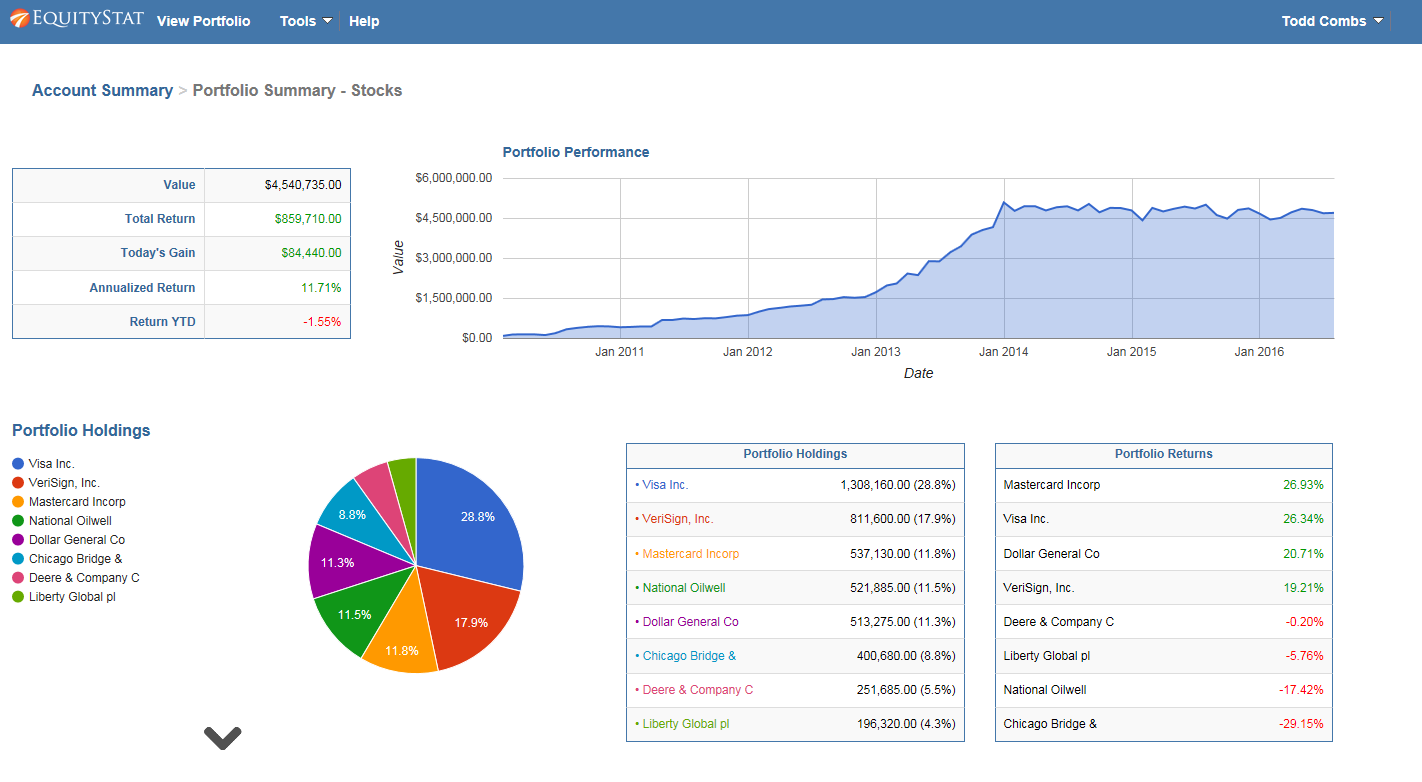
We have recently added a new feature.   You can now get an analysis of  your account and portfolios.  To perform a portfolio analysis click the Tools menu and choose Analyze Portfolio from the drop down menu.

EquityStat Investment Portfolio Analysis
Stock Portfolio Analysis Page

Our portfolio analysis feature provides you an performance overview of your account/portfolio.  You can easily see how your account/portfolio is performing over time, the holdings in your account/portfolio and performance metrics for each investment in your account/portfolio.

If you have multiple portfolios, the analysis page will first display how your entire account is performing.  You can see performance metrics for each individual portfolio and a graph showing the growth of your account over time.  In addition you can see your account’s investment holdings and a ranking of each investment return.  The analysis will also provide performance metrics on each investment.  You can see which investment is your best/lowest for the day, quarter and the year.  A list of your best investments and a list of your lowest investments is also provided.

If you want to see an analysis of each individual portfolio click on the portfolio name in the portfolio summary table.  You will then be shown an analysis for that portfolio.  You will get the same graphs and performance metrics that were provided on the account level, but for the individual portfolio.

If you only have one portfolio, by default you will be shown the analysis for your only portfolio.

New Features in the Portfolio Manager

We have added a few new features to the portfolio manager.

Portfolios

You can now create multiple portfolios to group your investments from multiple accounts.  For example, you can have a portfolio for your stocks, mutual funds and 401k.  To create a new portfolio click the New menu and then choose the New Portfolio menuitem.  Click here to learn more about portfolios.

New Performance Metrics/Columns

We have added a few new performance metrics – Quarter Return, P/E ratio and Dividend Yield.  To see these columns in your portfolio click the Options menu and then choose the Change Columns menuitem.

Maximize Portfolio

There are times when all the investments in the top portion of your portfolio don’t display.  To see all of your investments you have to scroll around.  We have added the ability to maximize the portfolio so that we display as many investments as we can.   To maximize your portfolio click the three line graphic in the upper left hand corner of your portfolio and choose Maximize from the drop down menu.  The top portion of your portfolio will be expanded and the transaction section will be moved down to accommodate the investments section.  This just gives you a way to make the most of your screen space and display more of your investment data.  To restore your portfolio in panes (the default setting) click the Restore menuitem from the drop down menu.

Do you have any ideas for a new feature? Contact us and let us know.


Creating multiple portfolios – New Feature

We recently added a new feature to your EquityStat portfolio manager. You can now create multiple portfolios for your account. Having multiple portfolios gives you the ability to group and separate your investments. For example, you can have a portfolio for your individual stocks, a portfolio for your mutual funds and a portfolio for your 401K.

To add a new portfolio click the New menu and then chose the New Portfolio menuitem from the dropdown menu.

Create a New EquityStat Portfolio
How to create a new portfolio in EquityStat

You will then see two new tabs. A tab for your current portfolio and a tab for your new portfolio.

Change Portfolio Name EquityStat
How to change the portfolio name

To edit the name of your portfolio click the pencil icon, which will display an edit box.

Edit Portfolio Name
How to edit a portfolio name.

Next type over the current portfolio name with the new portfolio name and click the Save button.

View portfolio investments
View a specific portfolio

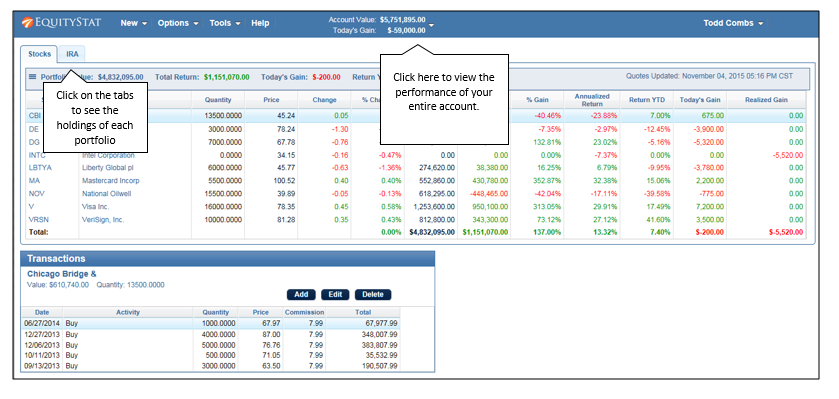
To view the investments of each portfolio click on the portfolio’s tab. From here you can also add new investments to the portfolio as well as edit investments.

To view the view the performance all your entire account (all portfolios) click the Account Value box at the top.

To delete a portfolio first delete all the investments in the portfolio. Once the portfolio is empty, click the ‘X’ icon in the portfolio tab.