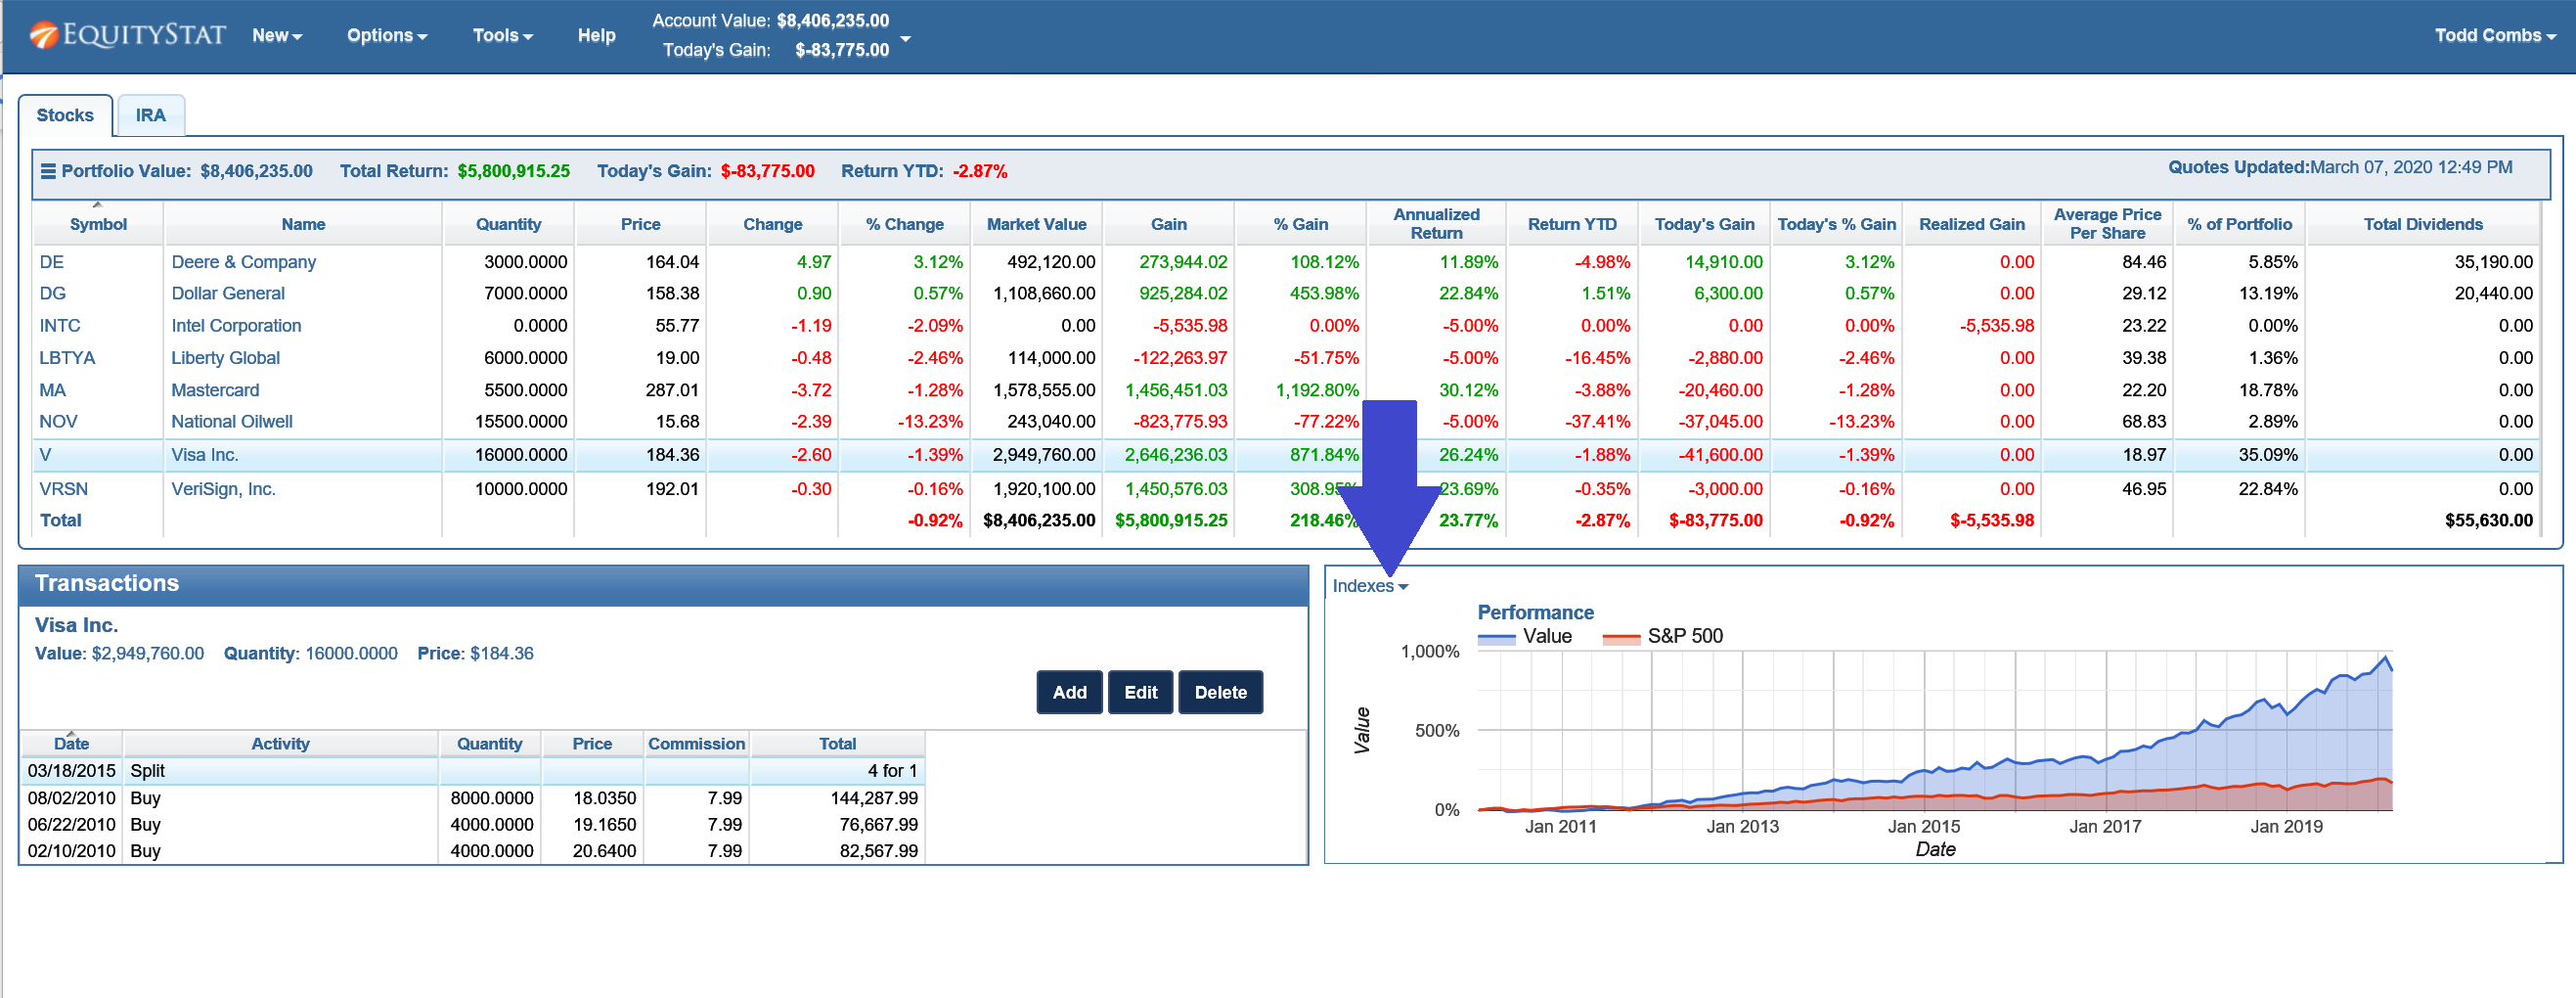
If you want to see how your investment performance is doing compared to an index, you can easily add an index to your investment’s performance graph.
To do this, select the index you want to compare, by clicking on the Indexes drop down menu link in the upper left hand corner of the performance graph.
Compare Investment Performance to Indexes
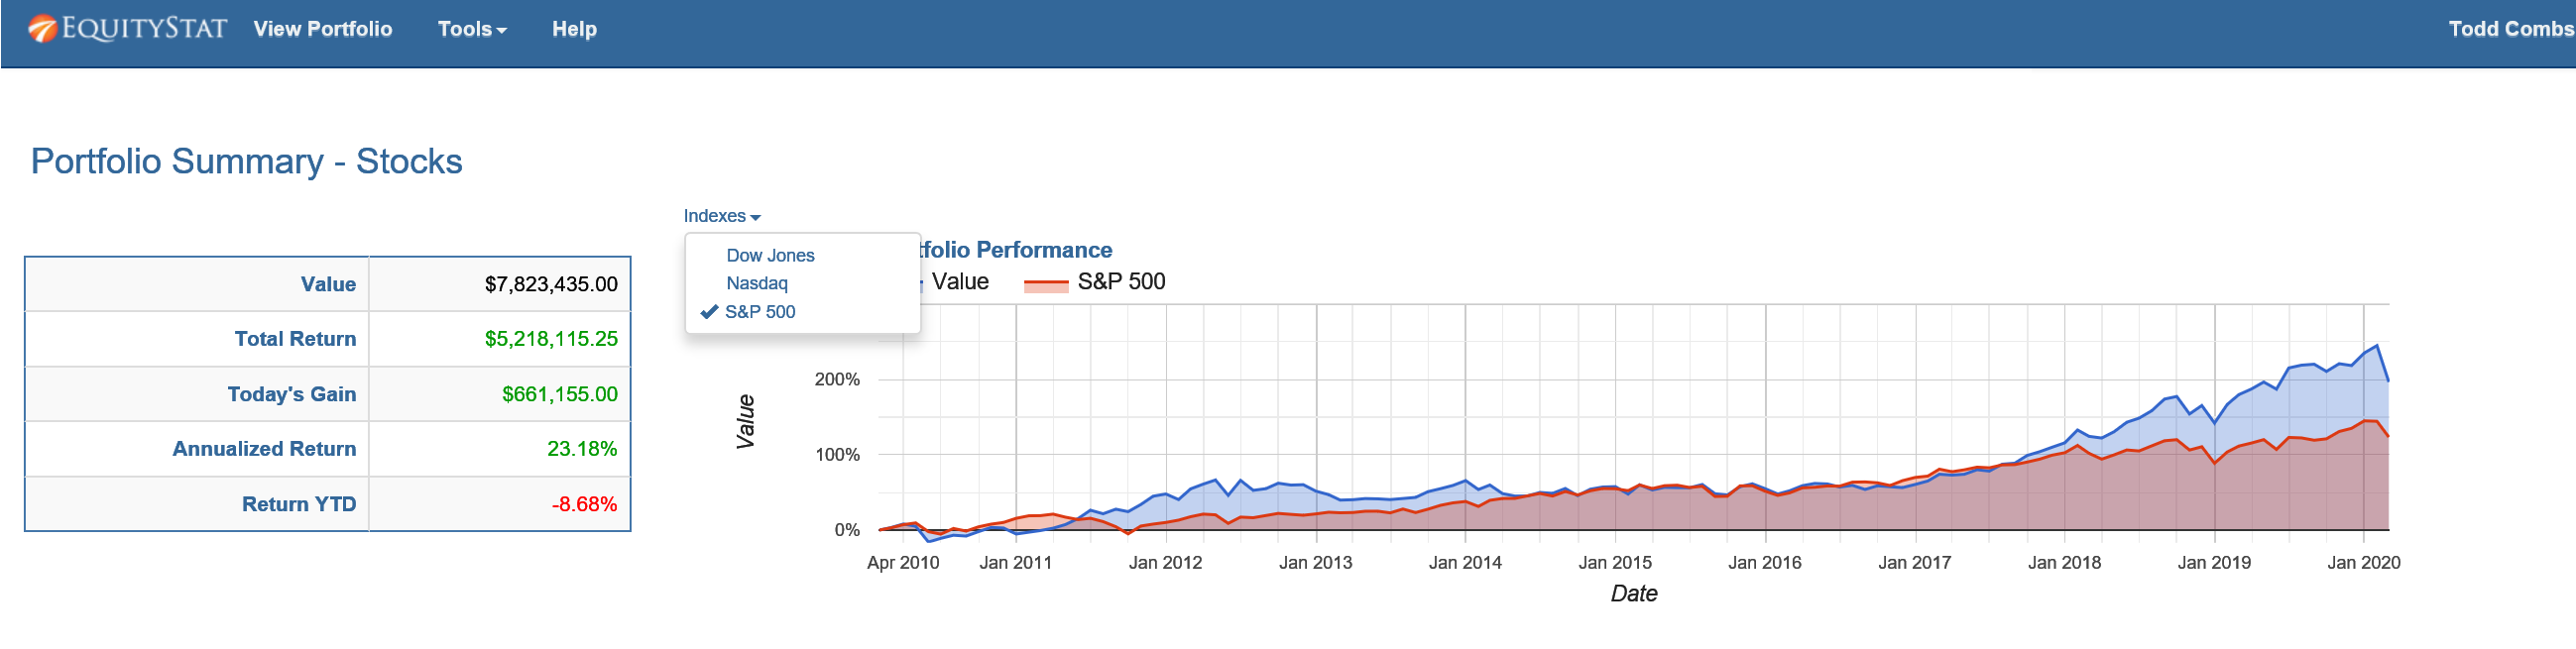
When you click on the Indexes drop down menu link, you can choose from a list of indexes.
Choose to compare your stock’s performance to the Dow Jones index, the Nasdaq index or the S&P 500 index
Choose the Dow Jones index, the Nasdaq index or the S&P 500 index. You can choose one index or multiple indexes. When you choose an index, you will see a checkbox next to the index.
Once an index is chosen, you will see the index in your performance graph and how it compares to your investment’s performance.
To remove an index, click on the Indexes drop down link and select the index again. This will remove the checkbox from the index menu item and remove the index from your performance graph.
You can also compare your account/portfolio performance to an index. To do this, go to the Portfolio Analysis page by choosing the Tools menu at the top and selecting Analyze Portfolio from the drop down menu. From the Portfolio Analysis page, click the Indexes link above the performance graph and choose the index or indexes you want to compare.
Choose to compare your account/portfolio performance to the Dow Jones index, the Nasdaq index or the S&P 500 index
How did your investments do in 2016? What was your best stock? If you are not tracking your investment’s performance, consider using EquityStat. With EquityStat you can track the overall performance of your portfolio/account as well as the performance of each individual investment. EquityStat tracks the annualized return, year to date return, daily gain, overall gain and many other metrics of your investments. With these metrics you can easily determine what are your best investments.
Many online brokerages and mutual funds track an individual stock or mutual fund’s performance but you cannot get the overall return of all your stocks or mutual funds. With EquityStat not only can you get the return each investment, you can also get the return for your entire account. This way you know how well your investments are performing at any time.
How did your investments do in 2016? What was your best stock? What was your worst?
If you are not tracking your investment’s performance, consider using EquityStat. With EquityStat you can track the overall performance of your portfolio as well as the performance of each individual investment. EquityStat tracks the annualized return, daily gain, overall gain and many other metrics of your investments. With these metrics you can easily determine what are your best investments and what are your worst investments.
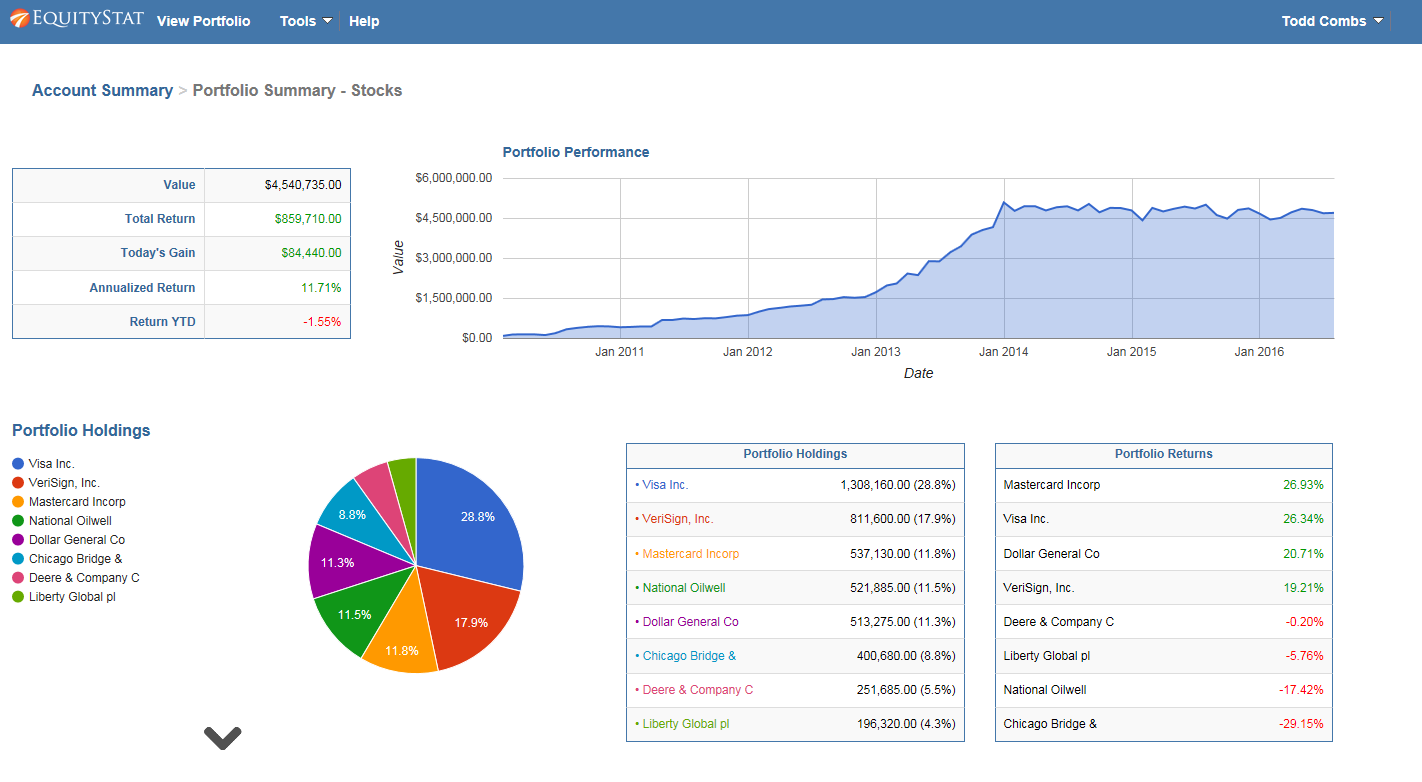
Portfolio Analysis Example
In addition EquityStat provides an analysis of your account and portfolios. With our account/portfolio analysis you can get a graphical and tableuare view of the performance of your investments. For example, you can see the performance of your account/portfolio overtime. Using the account/portfolio analysis you can also see which investments were your best performing investments and which investments were your least performing investments.
How to Analyze Your Investment Portfolio in EquityStat
EquityStat has introduced a powerful Portfolio Analysis tool that helps investors evaluate performance, track holdings, and compare returns across multiple portfolios. This feature gives you a clear, data‑driven view of how your investments are performing over time.
What the Portfolio Analysis Tool Does
The Portfolio Analysis page provides a complete performance overview of your account and individual portfolios. You can quickly see:
Overall account performance over time
Portfolio‑level performance metrics
Investment holdings and allocation
Daily, quarterly, and yearly performance rankings
Best‑ and worst‑performing investments
This makes it easy to understand which assets are driving your returns and where adjustments may be needed.
How to Access Portfolio Analysis in EquityStat
To run a portfolio analysis:
Click the Tools menu at the top navigation bar.
Select Analyze Portfolio from the dropdown.
The system will generate a detailed analysis of your account and portfolios.
What You’ll See on the Portfolio Analysis Page
Analyze Portfolio Example
1. Account‑Level Performance Overview
If you manage multiple portfolios, the analysis begins with a full account‑wide performance summary, including:
A performance graph showing account growth over time
A breakdown of each portfolio’s performance
A ranked list of investment returns
A summary of all holdings across your account
2. Portfolio‑Specific Analysis
Click any portfolio name in the summary table to view:
Portfolio‑specific performance charts
Individual investment metrics
Best and lowest performers for the day, quarter, and year
A complete holdings list for that portfolio
If you only have one portfolio, the system automatically displays its analysis.
Key Performance Metrics Provided
The analysis includes detailed metrics such as:
Total return
Daily return
Quarterly return
Year‑to‑date return
Investment rankings
Growth charts
These insights help you understand how each investment contributes to your overall performance.
Why This Matters for Investors
Whether you’re a beginner or an experienced investor, having a clear view of your portfolio’s performance is essential. EquityStat’s Portfolio Analysis tool helps you:
According to the Wall Street Journal the best stock of 2014 was Southwest Airlines (LUV). It was up 123%. The worst stock of 2014 was Transocean (RIG). It was down 62%.
How did your investments do in 2014? What was your best stock? What was your worst?
If you are not tracking your investment’s performance, consider using EquityStat. With EquityStat you can track the overall performance of your portfolio as well as the performance of each individual investment. EquityStat tracks the annualized return, daily gain, overall gain and many other metrics of your investments. With these metrics you can easily determine what are your best investments and what are your worst investments.