We have recently added the ability to view your portfolio on your mobile device. To view your portfolio on your mobile phone, launch your phone’s web browser and go to www.equitystat.com. Next, login to your EquityStat account. You will then see a scaled version of your portfolio designed to display on your mobile device.
Watch the following video to learn more about the features of the mobile portfolio manager.
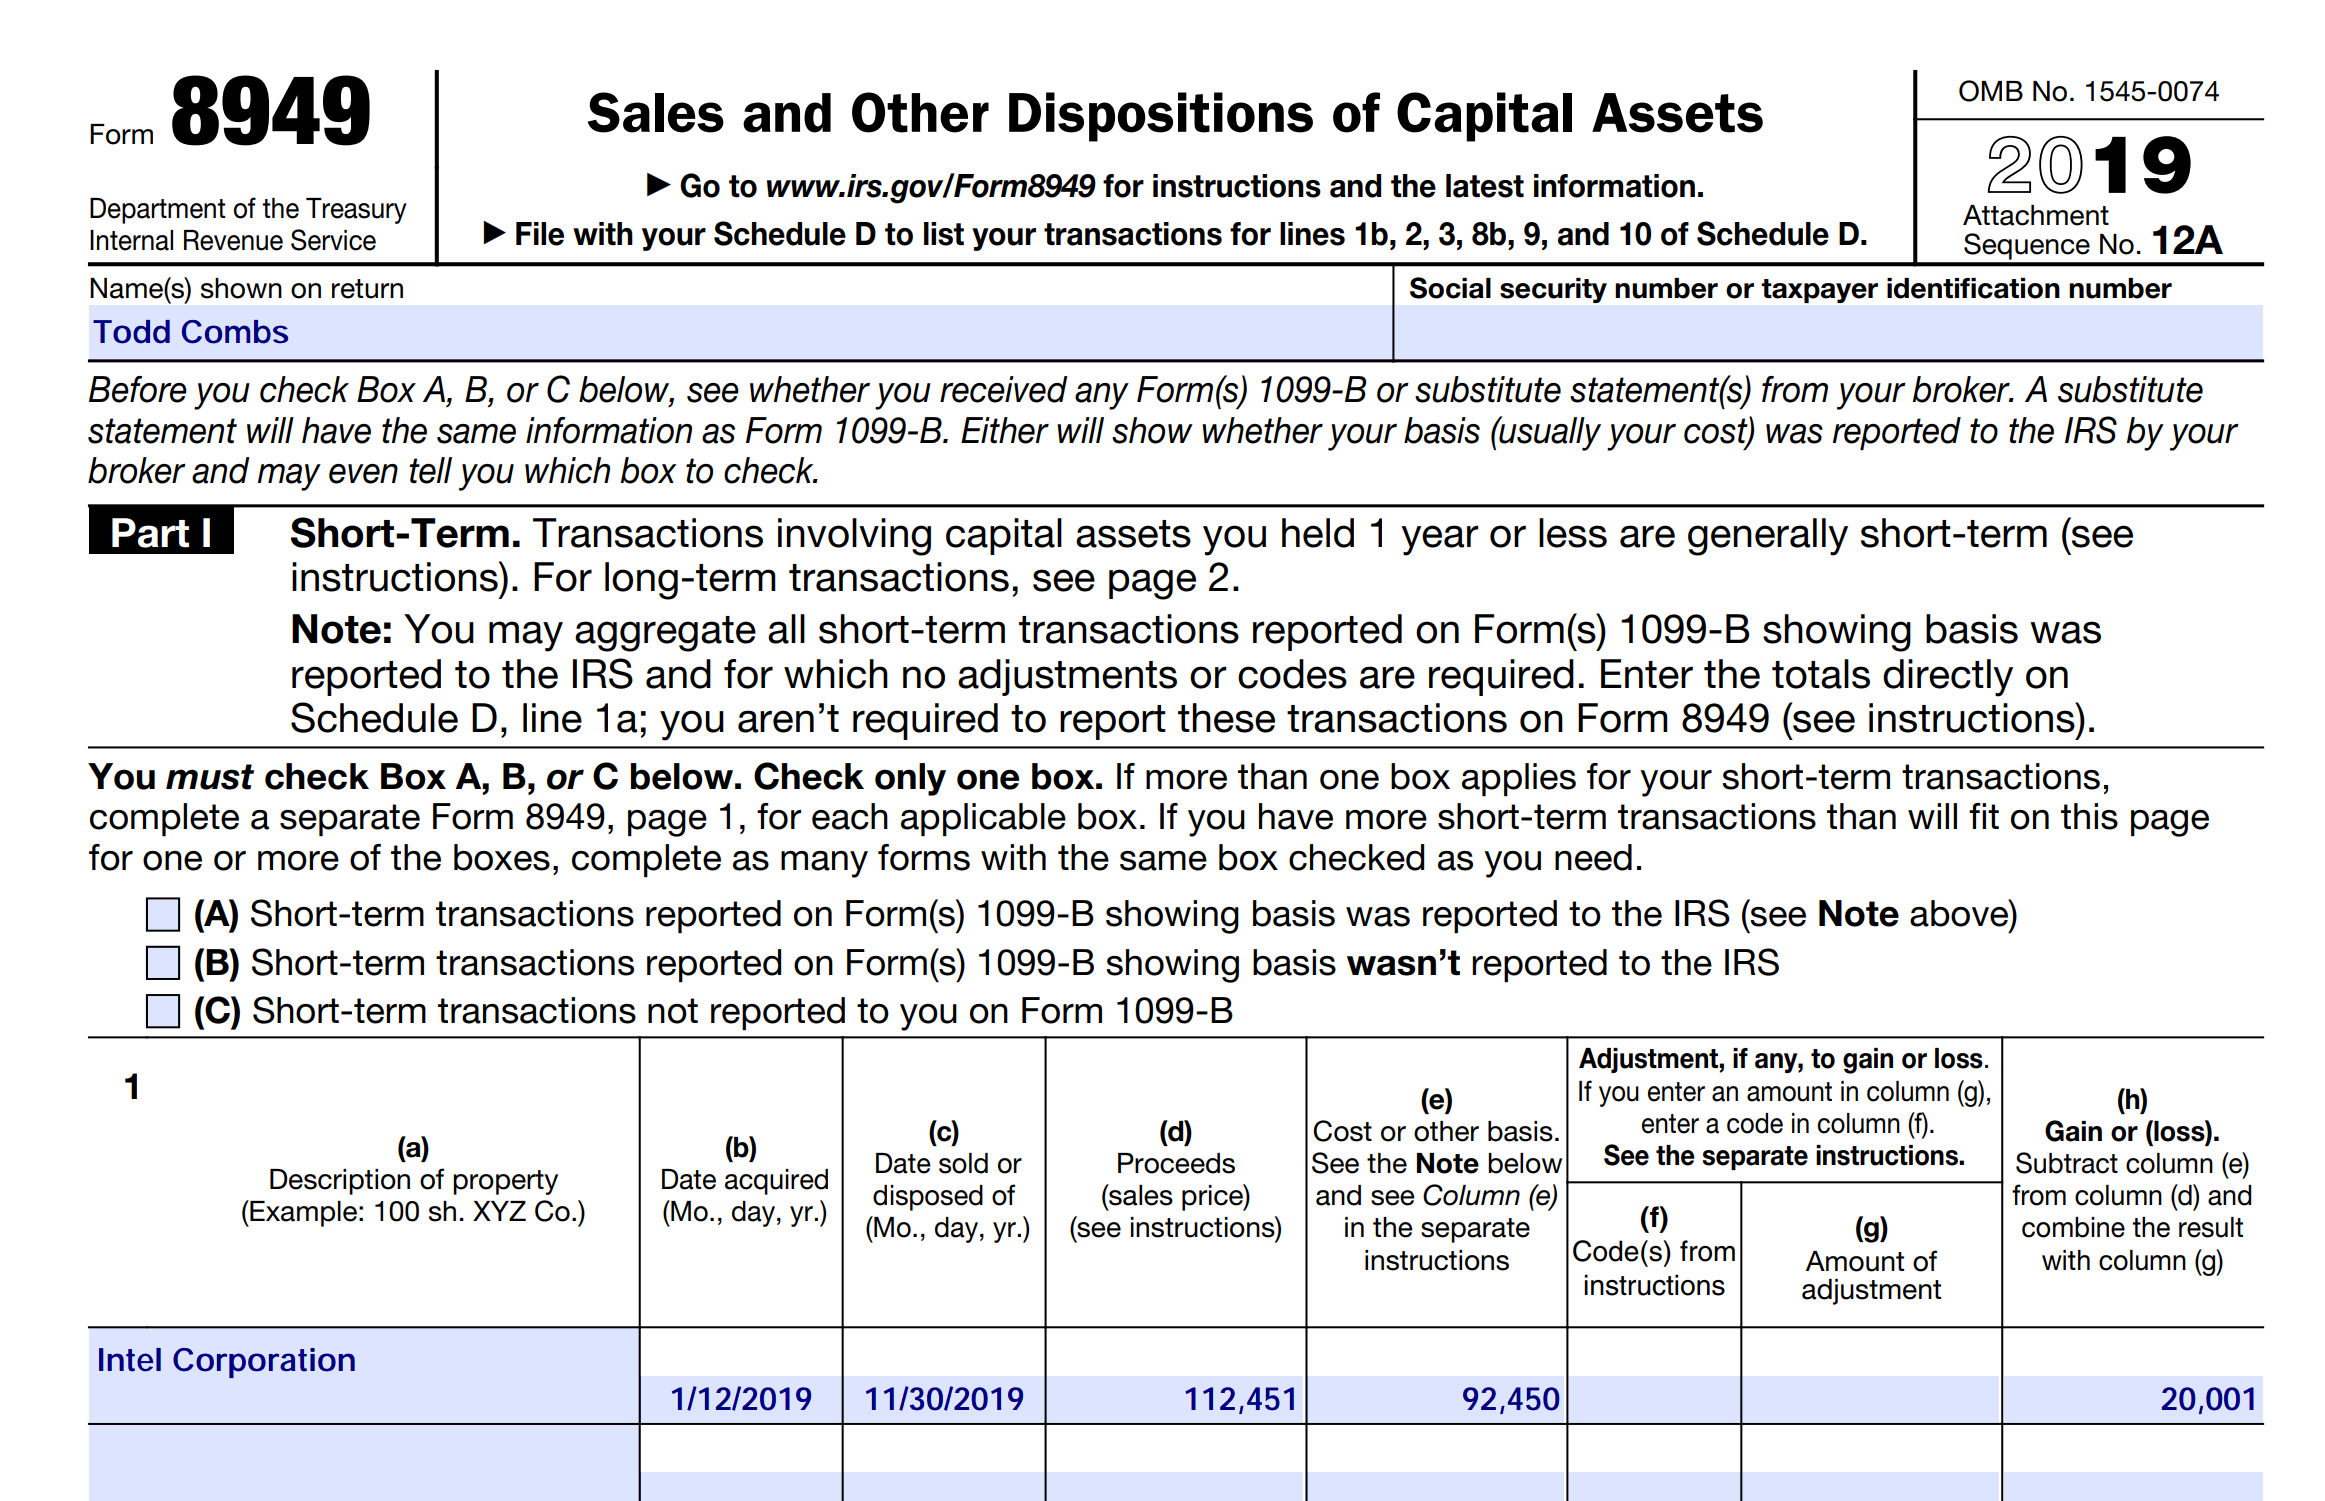
We just released the 2016 8949 IRS tax forms. IRS Form 8949 is a form that reports your short and long term gains for any sold investments in the tax year. You can give Form 8949 to your tax preparer which assists in preparing Schedule D on your tax return. To generate Form 8949 click the Tools menu and choose the “Generate Form 8949” menuitem.
EquityStat’s portfolio manager has been nominated for a Benzinga Tech Award in the Analysis Platforms and Tools Apps category. You can see the list of nominees here:
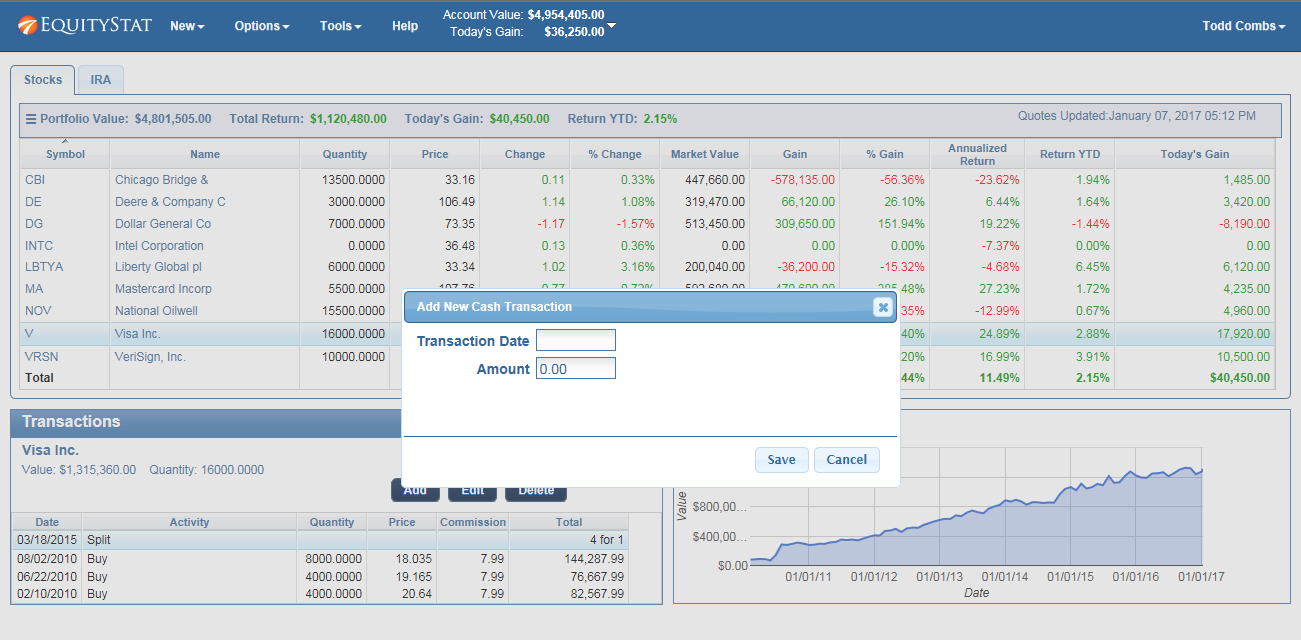
We have recently added a new feature. You can now add cash transactions to your portfolio. To add a cash transaction, click the New menu and then choose the “New Cash Transaction” menuitem from the drop down menu. In the popup dialog, add the date of the cash transaction and the amount of the transaction.
Add Cash To Your Investment Portfolio
Once you have added a cash transaction, any non-reinvested dividends added to your other investments will be added to your cash.
How to Analyze Your Investment Portfolio in EquityStat
EquityStat has introduced a powerful Portfolio Analysis tool that helps investors evaluate performance, track holdings, and compare returns across multiple portfolios. This feature gives you a clear, data‑driven view of how your investments are performing over time.
What the Portfolio Analysis Tool Does
The Portfolio Analysis page provides a complete performance overview of your account and individual portfolios. You can quickly see:
Overall account performance over time
Portfolio‑level performance metrics
Investment holdings and allocation
Daily, quarterly, and yearly performance rankings
Best‑ and worst‑performing investments
This makes it easy to understand which assets are driving your returns and where adjustments may be needed.
How to Access Portfolio Analysis in EquityStat
To run a portfolio analysis:
Click the Tools menu at the top navigation bar.
Select Analyze Portfolio from the dropdown.
The system will generate a detailed analysis of your account and portfolios.
What You’ll See on the Portfolio Analysis Page
Analyze Portfolio Example
1. Account‑Level Performance Overview
If you manage multiple portfolios, the analysis begins with a full account‑wide performance summary, including:
A performance graph showing account growth over time
A breakdown of each portfolio’s performance
A ranked list of investment returns
A summary of all holdings across your account
2. Portfolio‑Specific Analysis
Click any portfolio name in the summary table to view:
Portfolio‑specific performance charts
Individual investment metrics
Best and lowest performers for the day, quarter, and year
A complete holdings list for that portfolio
If you only have one portfolio, the system automatically displays its analysis.
Key Performance Metrics Provided
The analysis includes detailed metrics such as:
Total return
Daily return
Quarterly return
Year‑to‑date return
Investment rankings
Growth charts
These insights help you understand how each investment contributes to your overall performance.
Why This Matters for Investors
Whether you’re a beginner or an experienced investor, having a clear view of your portfolio’s performance is essential. EquityStat’s Portfolio Analysis tool helps you:
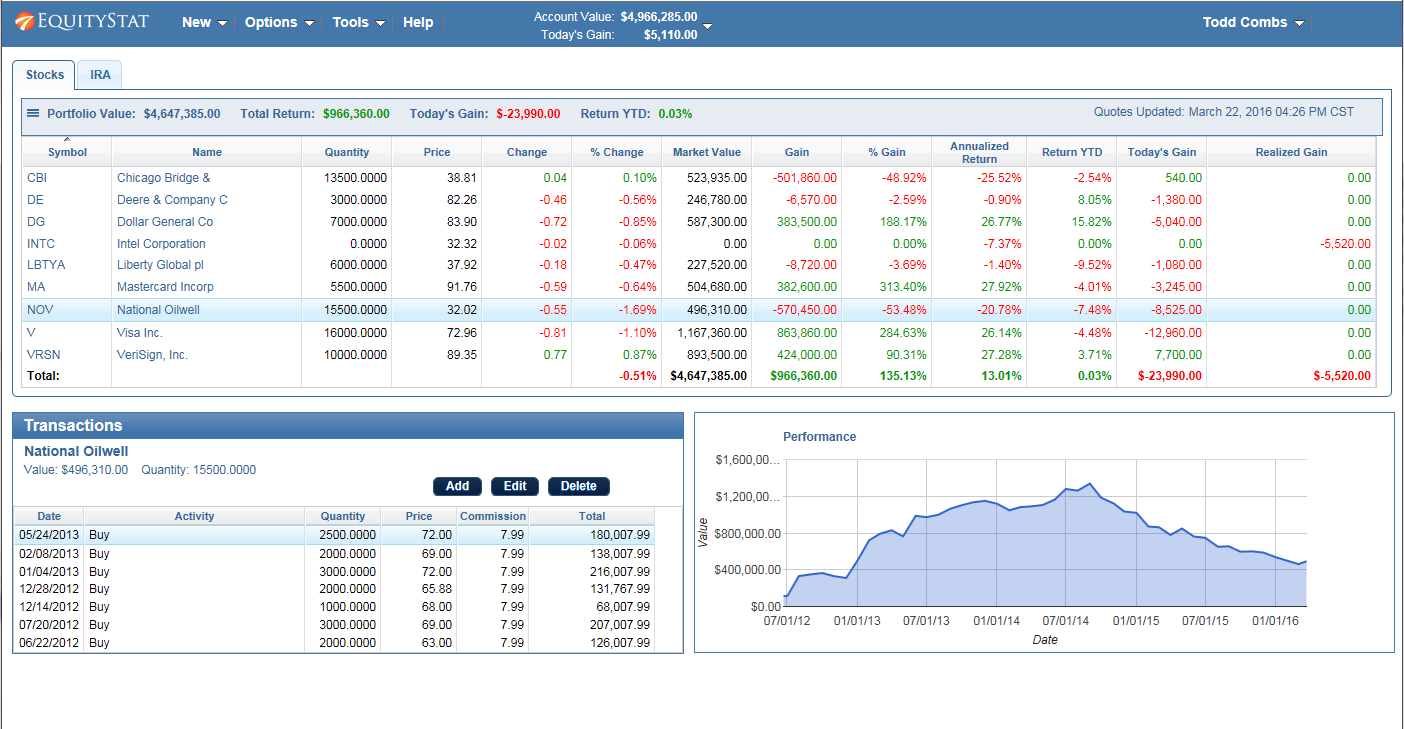
We have recently added a performance graph in the portfolio manager. For each investment in your portfolio you can see how that investment has performed over time. To see the investment graph, just click on an individual investment and the graph will display at the bottom right next to your list of transactions for the investment.
We just released the 2015 8949 IRS tax forms. If you have sold any stocks or mutual funds in 2015, then you can generate IRS Form 8949 to calculate your gain or loss on a stock sale. EquityStat will automatically calculate your short-term gains and losses and long-term gains and losses and generate a PDF 8949 form. You can then save or print out this form and give it to your accountant or tax preparer. To generate Form 8949 click the Tools menu and then select the Generate Form 8949 menuitem.
According to the Wall Street Journal the best stock of 2015 was Netflix. It was up 134%. The worst stock of 2015 was Chesapeake Energy. It was down 77%.
How did your investments do in 2015? What was your best stock? What was your worst? If you are not tracking your investment’s performance, consider using EquityStat. With EquityStat you can track the overall performance of your portfolio as well as the performance of each individual investment. EquityStat tracks the annualized return, year to date return, daily gain, overall gain and many other metrics of your investments. With these metrics you can easily determine what are your best investments and what are your worst investments.
Here is a quick getting started guide for using EquityStat’s portfolio manager.
Add transactions to EquityStat
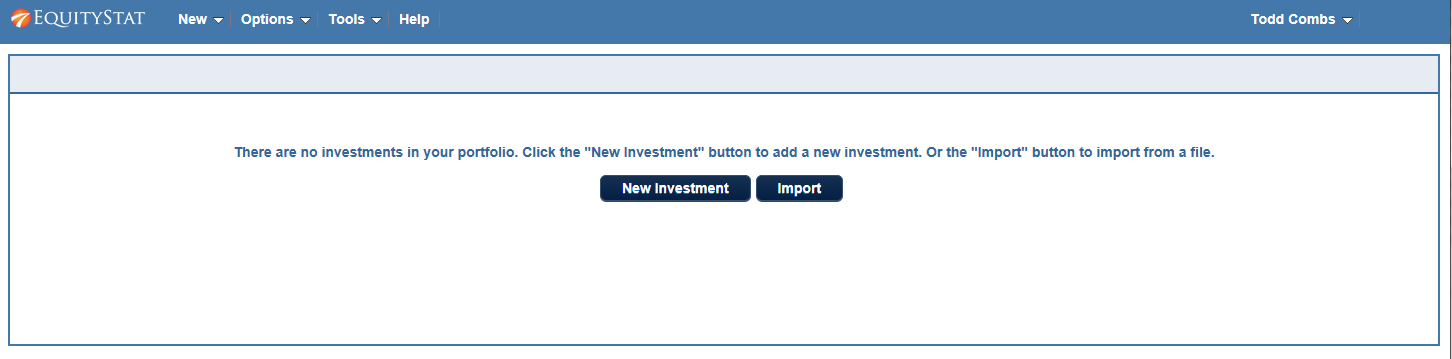
After you join EquityStat, you will be logged into your account. Since you have no investments in your portfolio, you will see the page above. From this page you can click the New Investment button to add a new investment to your portfolio.
After clicking the New Investment button, you will be presented a dialog where you can enter a buy transaction for your investment. Using the dialog, enter the symbol of your investment, the date the purchase took place, the amount of shares purchased and the price for each share. When finished click the Save button. Once you have entered your first purchase, you can then enter other transactions such as other buys, sells and dividends.
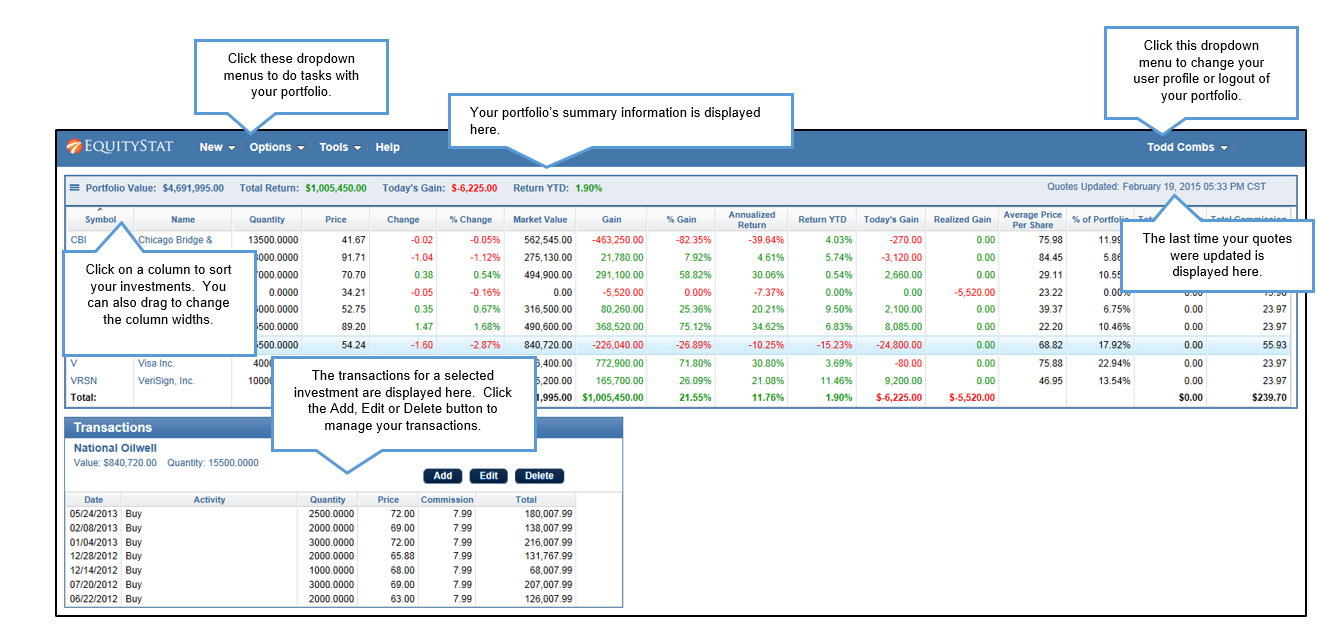
Directions on EquityStat’s Portfolio Manager
The image above shows a portfolio with several investments already entered. The top table will show all of your investments along with data about the investments. Below the investment table are the transactions for the selected investment. You can sort your investments and transactions by clicking on a column heading. In addition you can expand a column by putting your mouse between columns and then drag to lengthen the width of the column. Above the investment table is a summary of the portfolio which will show you the total portfolio value, the total dollar return, the gain/loss for the day and the year-to-date return.
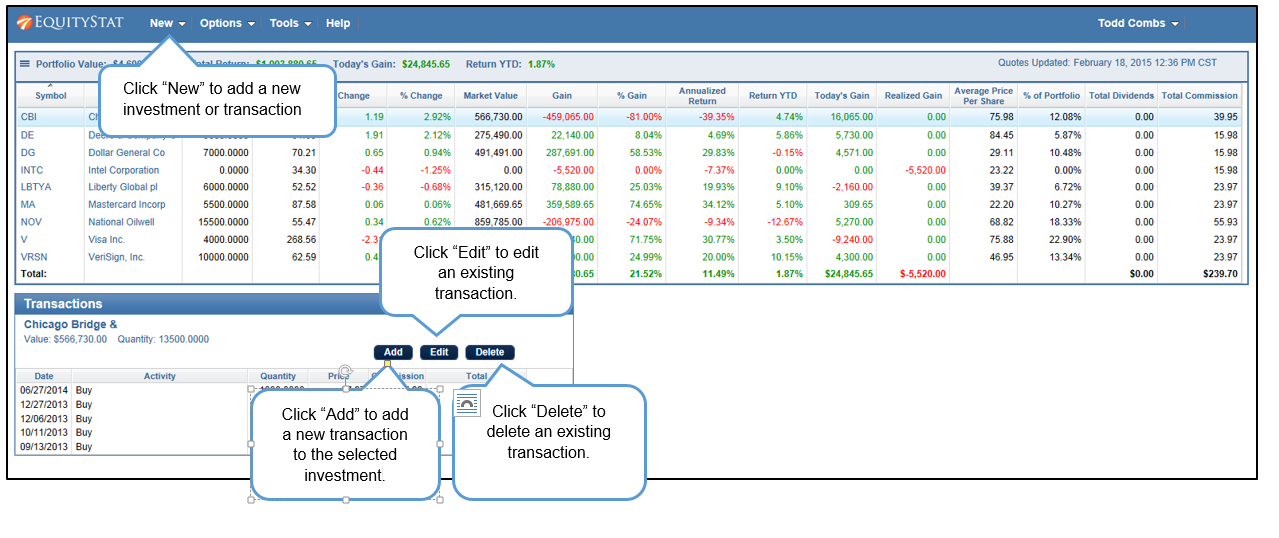
How to add transactions to EquityStat
If you want to enter a new investment that is not in your portfolio, click the New menu and then choose the New Investment menuitem. If you want to add transactions to an existing investment, go to the transaction table below the investment table and click the Add button. A new row will then be added to the transaction table where you can add a new buy, sell, dividend transaction as well as many other transaction types. You can also edit an individual transaction by selecting the transaction and clicking the Edit button. If you want to remove a transaction, click the Delete button.
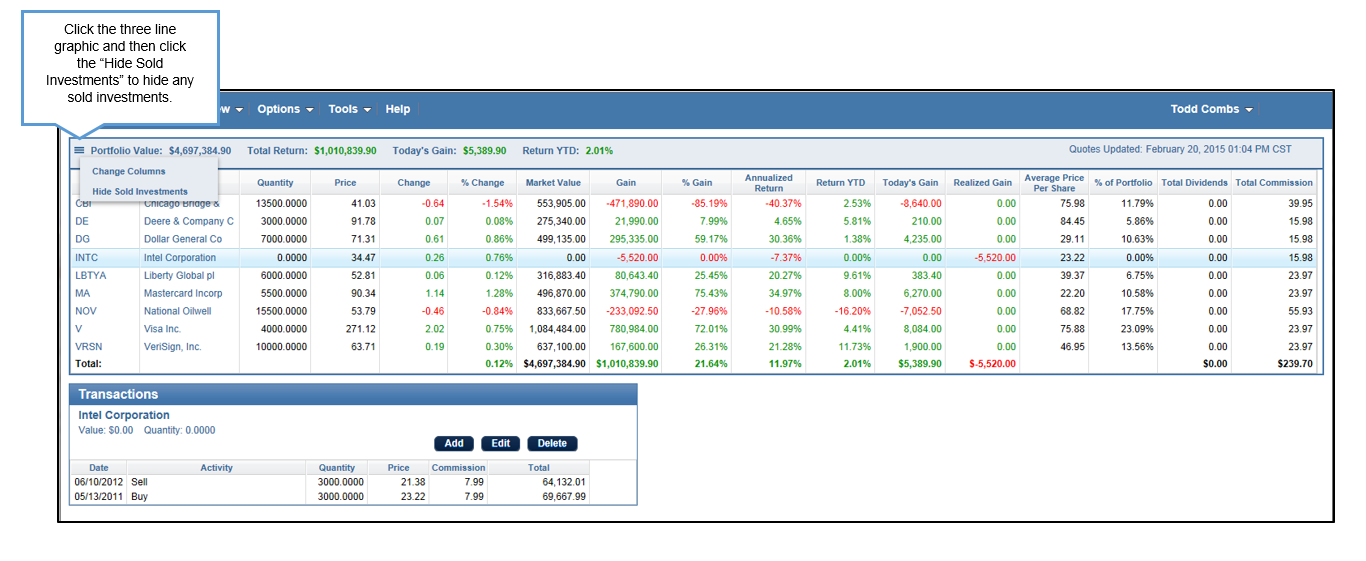
How to hide sold investments in your portfolio
If you have investments in our portfolio that have been sold and you don’t want them to show, click the three line graphic at the left and choose Hide Sold Investments menuitem. This will hide any sold investments. To view your sold investments click the graphic again and choose View Sold Investments.