We are hearing from a lot of frustrated Yahoo Finance Portfolio users. The latest changes to “improve” the portfolio manager have actually made the product worse. If you are looking for an alternative to Yahoo Finance stock portfolio, we encourage you to take a look at EquityStat’s portfolio manager.
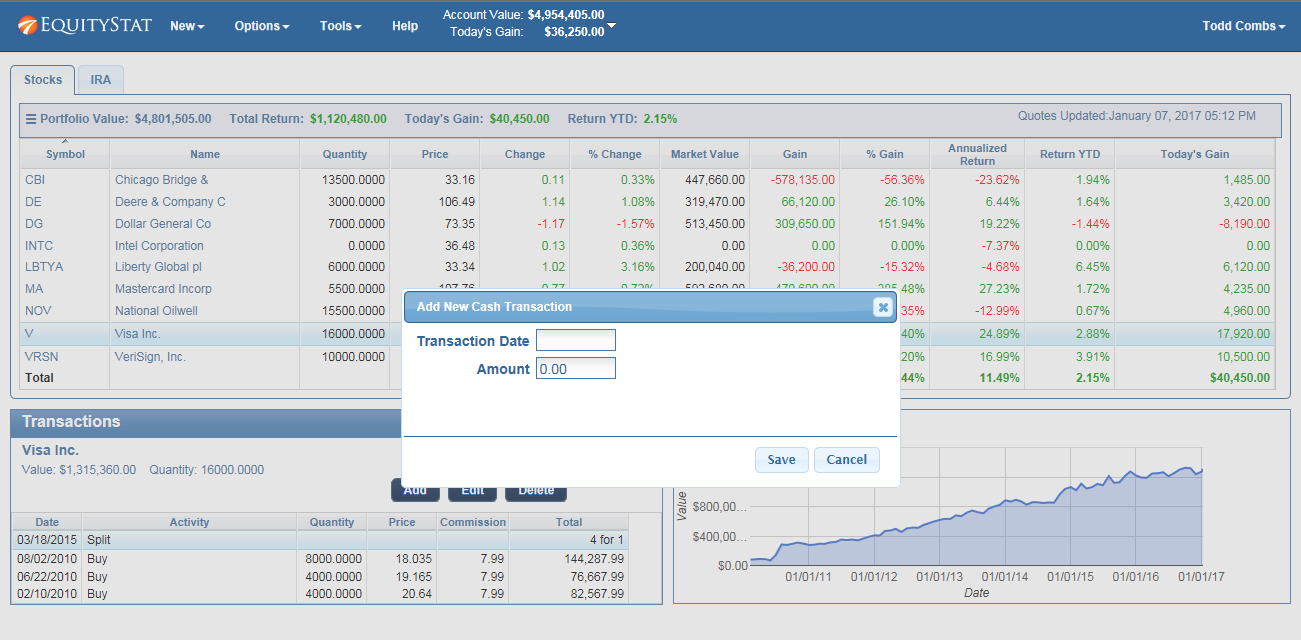
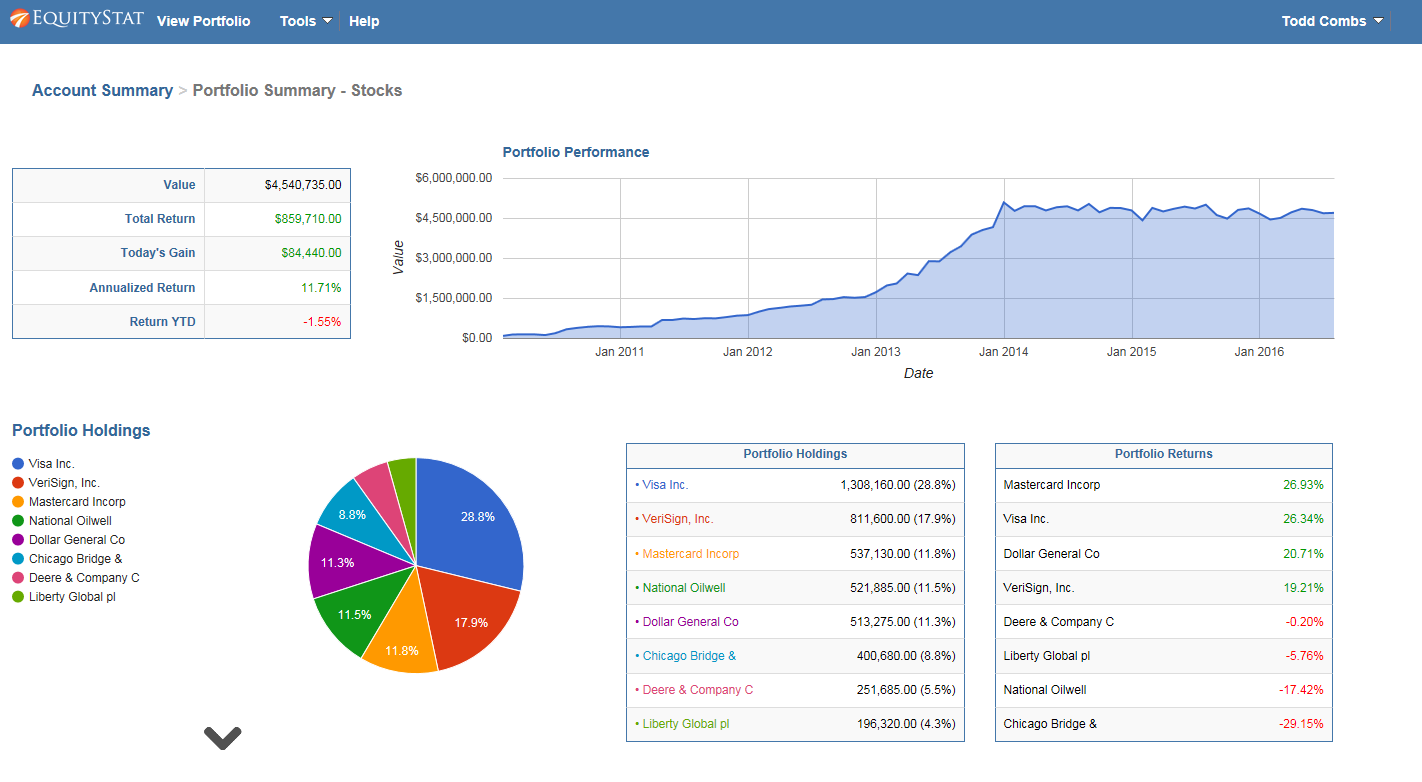
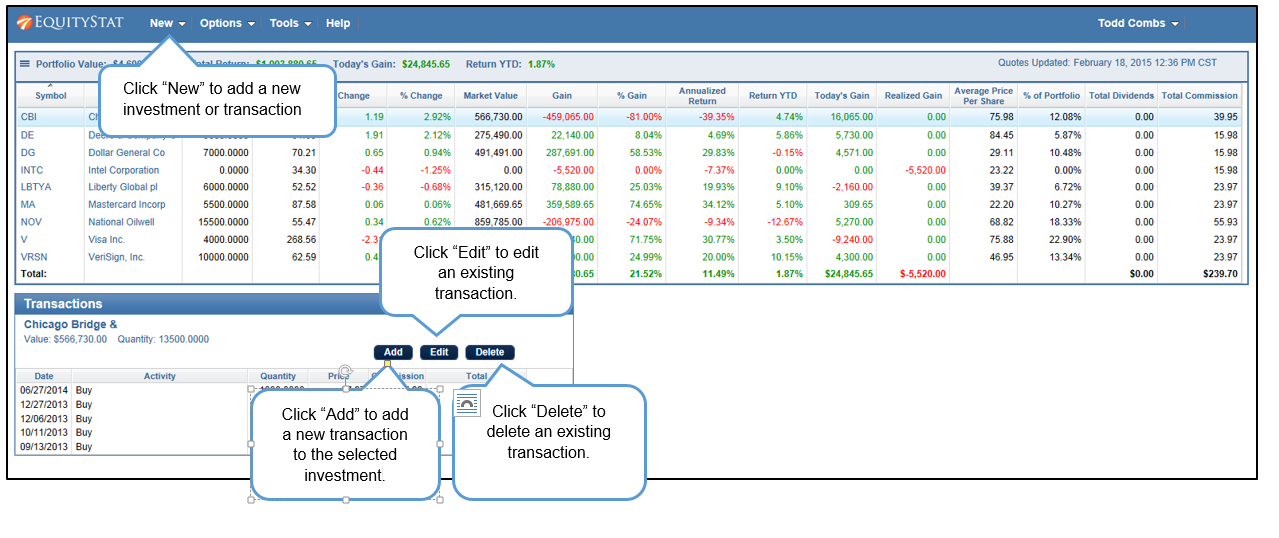
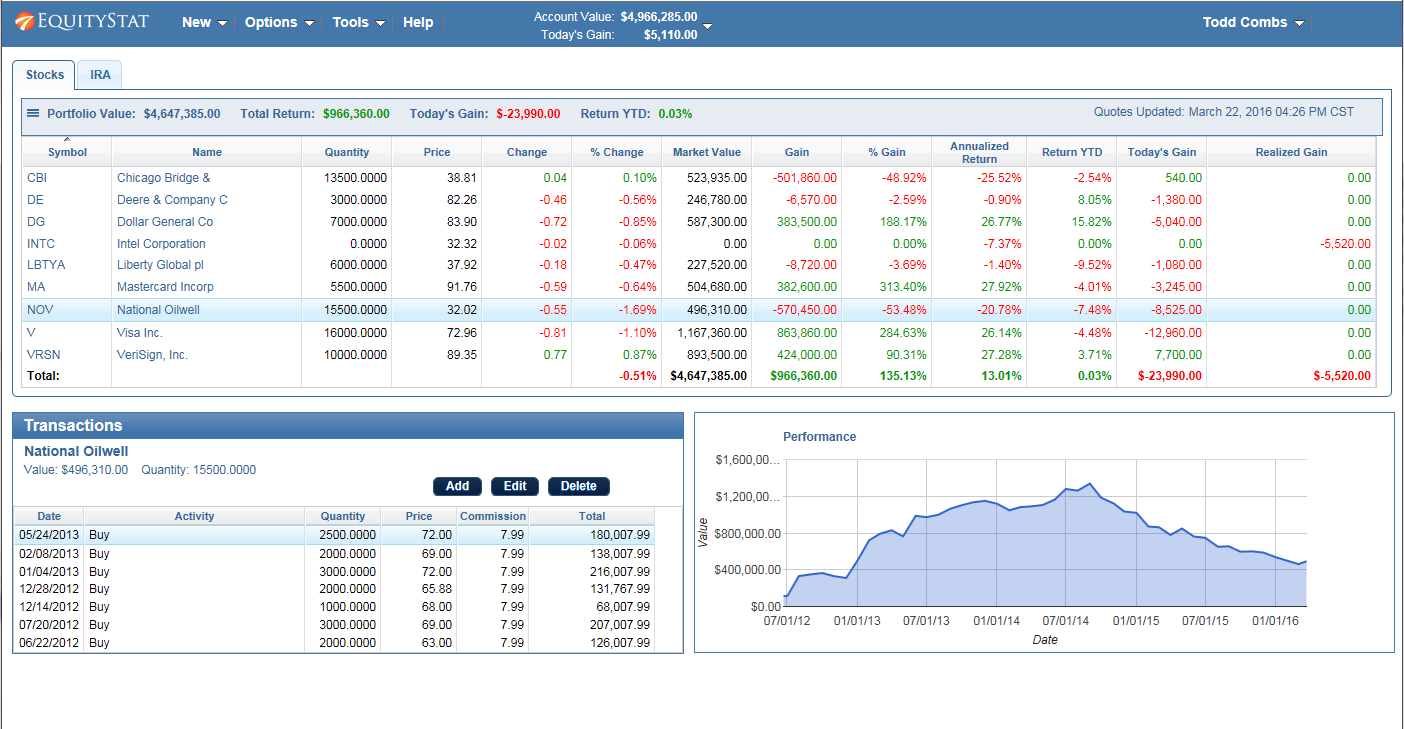
EquityStat was founded by investors. As investors we understand what other investors are looking for in a portfolio manager. For example, one of our goals was to make EquityStat’s Portfolio manager show as much information on your screen without you having to constantly scroll around to see your data. Unlike Yahoo, EquityStat does not show ads, so this gives us more room to show more information about your investments and how they are performing.
You can learn more about the similarities and differences between Yahoo Finance’s portfolio manager and EquityStat’s portfolio manager here.
In addition if there is any feature that you liked in Yahoo Finance’s portfolio manager that is missing in EquityStat, let us know. We will seriously consider adding this feature as well as any other feature you might find useful. Our goal is to keep enhancing EquityStat to give our users the features and services they want!