Yahoo Finance Has Changed Its Portfolio Manager
Yahoo Finance recently updated its investment portfolio manager, and many long‑time users are finding the new version harder to use or missing key features. If you relied on Yahoo Finance to track your stocks, ETFs, or mutual funds, EquityStat offers a powerful, easy‑to‑use alternative with more flexibility and better performance tracking.
Why Many Investors Are Looking for a Yahoo Finance Alternative
Yahoo Finance’s portfolio manager was once one of the most popular online tools for tracking investments. But recent changes have removed features, altered layouts, and made the interface less intuitive for many users.
If you’re searching for a replacement that feels familiar but offers more control, EquityStat is designed for exactly that.
EquityStat: A Modern, Feature‑Rich Alternative to Yahoo Finance Portfolios
EquityStat includes many of the same features Yahoo Finance users expect — plus several advanced tools Yahoo does not offer.
Core Features Similar to Yahoo Finance
- Track stocks, ETFs, and mutual funds
- View current portfolio value
- Monitor daily gain/loss
- See percentage gain since purchase
- Review realized gains
- Access full transaction history
These features make the transition from Yahoo Finance smooth and familiar.
Features EquityStat Offers That Yahoo Finance Does Not
EquityStat includes several powerful tools that go beyond Yahoo’s capabilities:
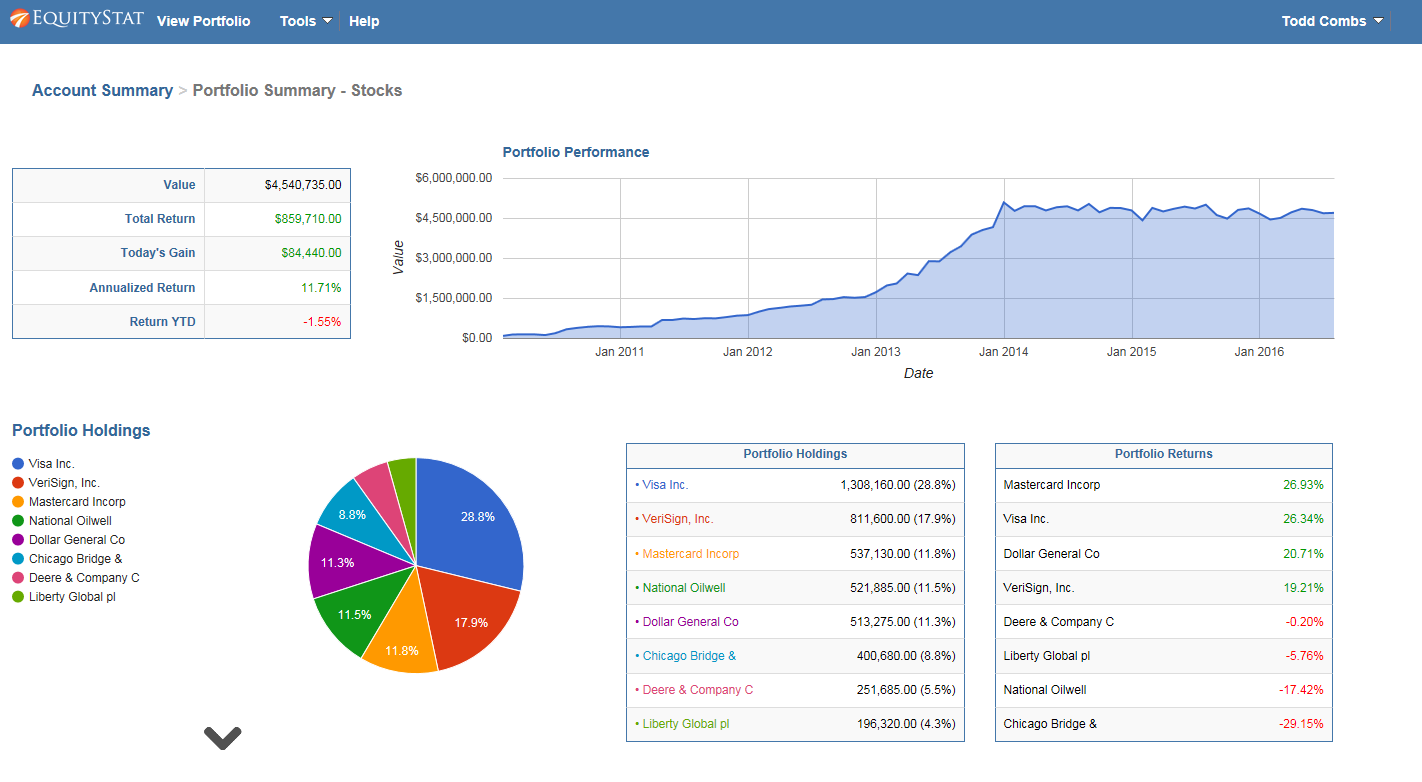
1. Clear, At‑a‑Glance Portfolio Performance
At the top of your dashboard, you immediately see:
- Total portfolio value
- Total return
- Today’s gain/loss
No extra clicks. No digging through menus.
2. Create Multiple Portfolios
Organize your investments into separate portfolios such as:
- Personal brokerage
- 401(k) or IRA
- Joint accounts
- Taxable vs. tax‑advantaged accounts
Track each portfolio individually or view your entire account’s performance.
3. Less Scrolling, More Data
EquityStat automatically adjusts to your screen size, making it easier to view all your data without endless scrolling — something Yahoo’s layout struggles with.
4. Detailed Performance Calculations
For each investment, portfolio, and your overall account, you can view:
- Current market value
- Total gain
- Today’s gain
- Annualized return
- Cost basis
- And more
These metrics help you understand exactly how your investments are performing.
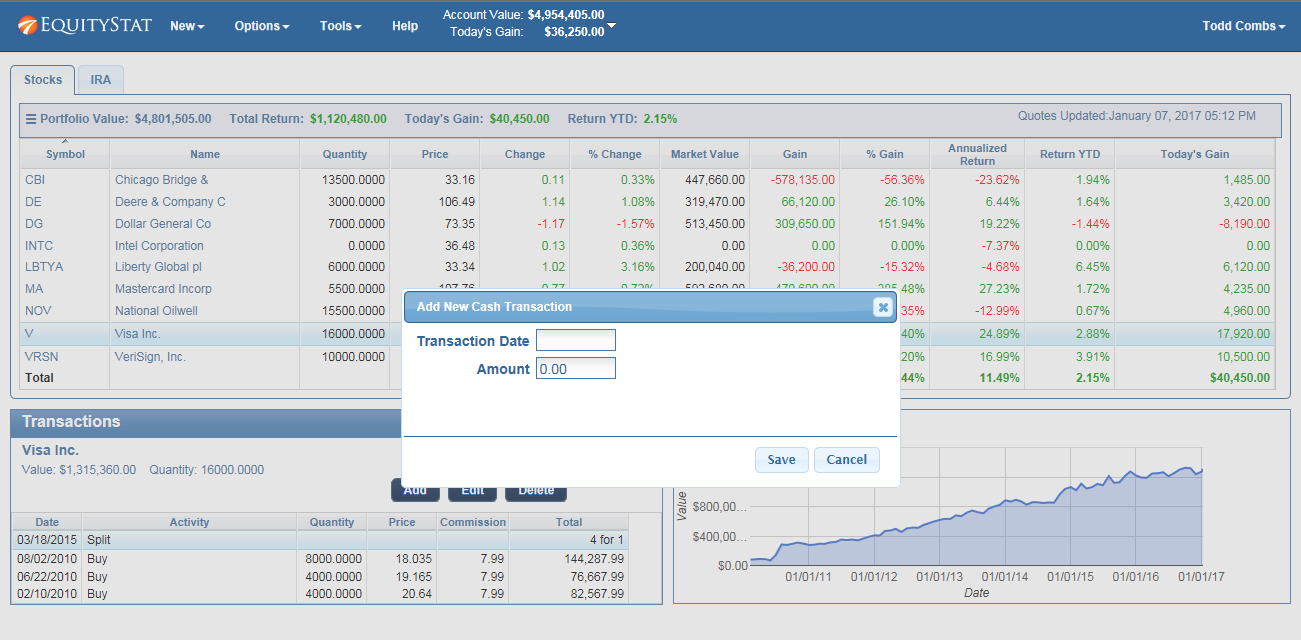
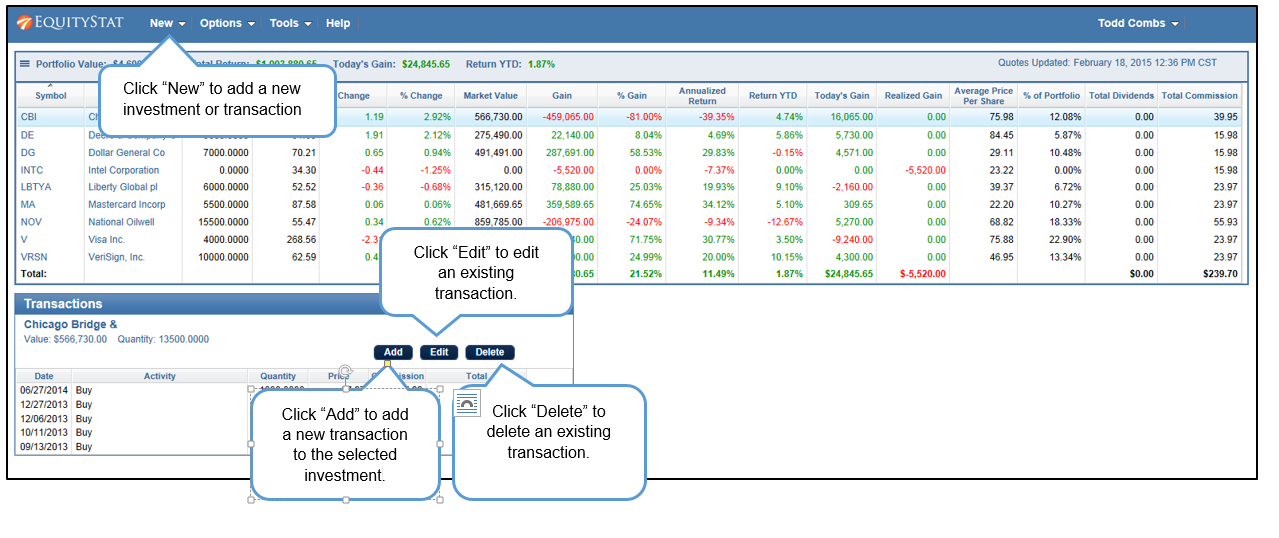
5. Full Transaction Management
For each investment, you can easily:
- View all transactions
- Add new transactions
- Edit existing entries
- Delete incorrect entries
Everything is grouped neatly for fast access.
6. Hide or Show Sold Investments
Toggle between:
- A clean view of current holdings, or
- A full historical view including sold positions
Perfect for tax planning and performance review.
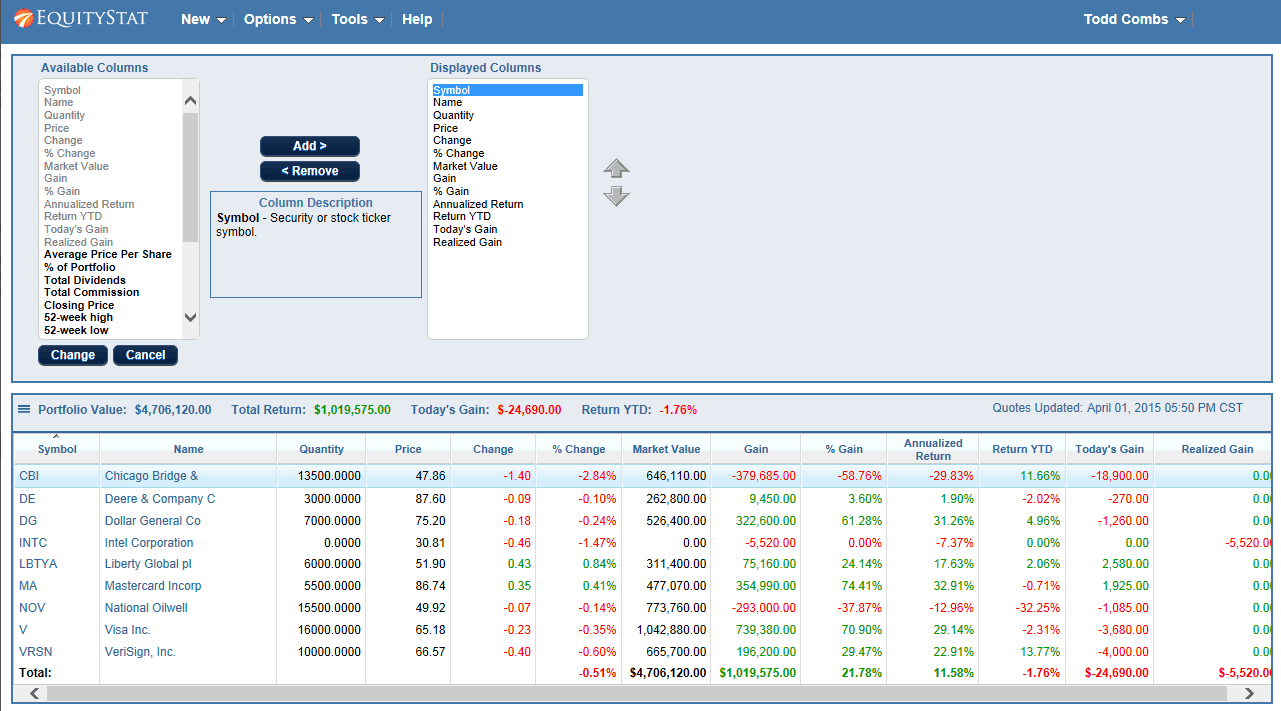
7. Customize Your Portfolio Columns
Add or remove data columns such as:
- 52‑week high
- 52‑week low
- Dividend yield
- Market cap
- Sector
Build the exact view you want — something Yahoo Finance does not allow.
8. Import Your Data Easily
Upload your transactions using:
- A spreadsheet
- A CSV file
No need to re‑enter years of history manually.
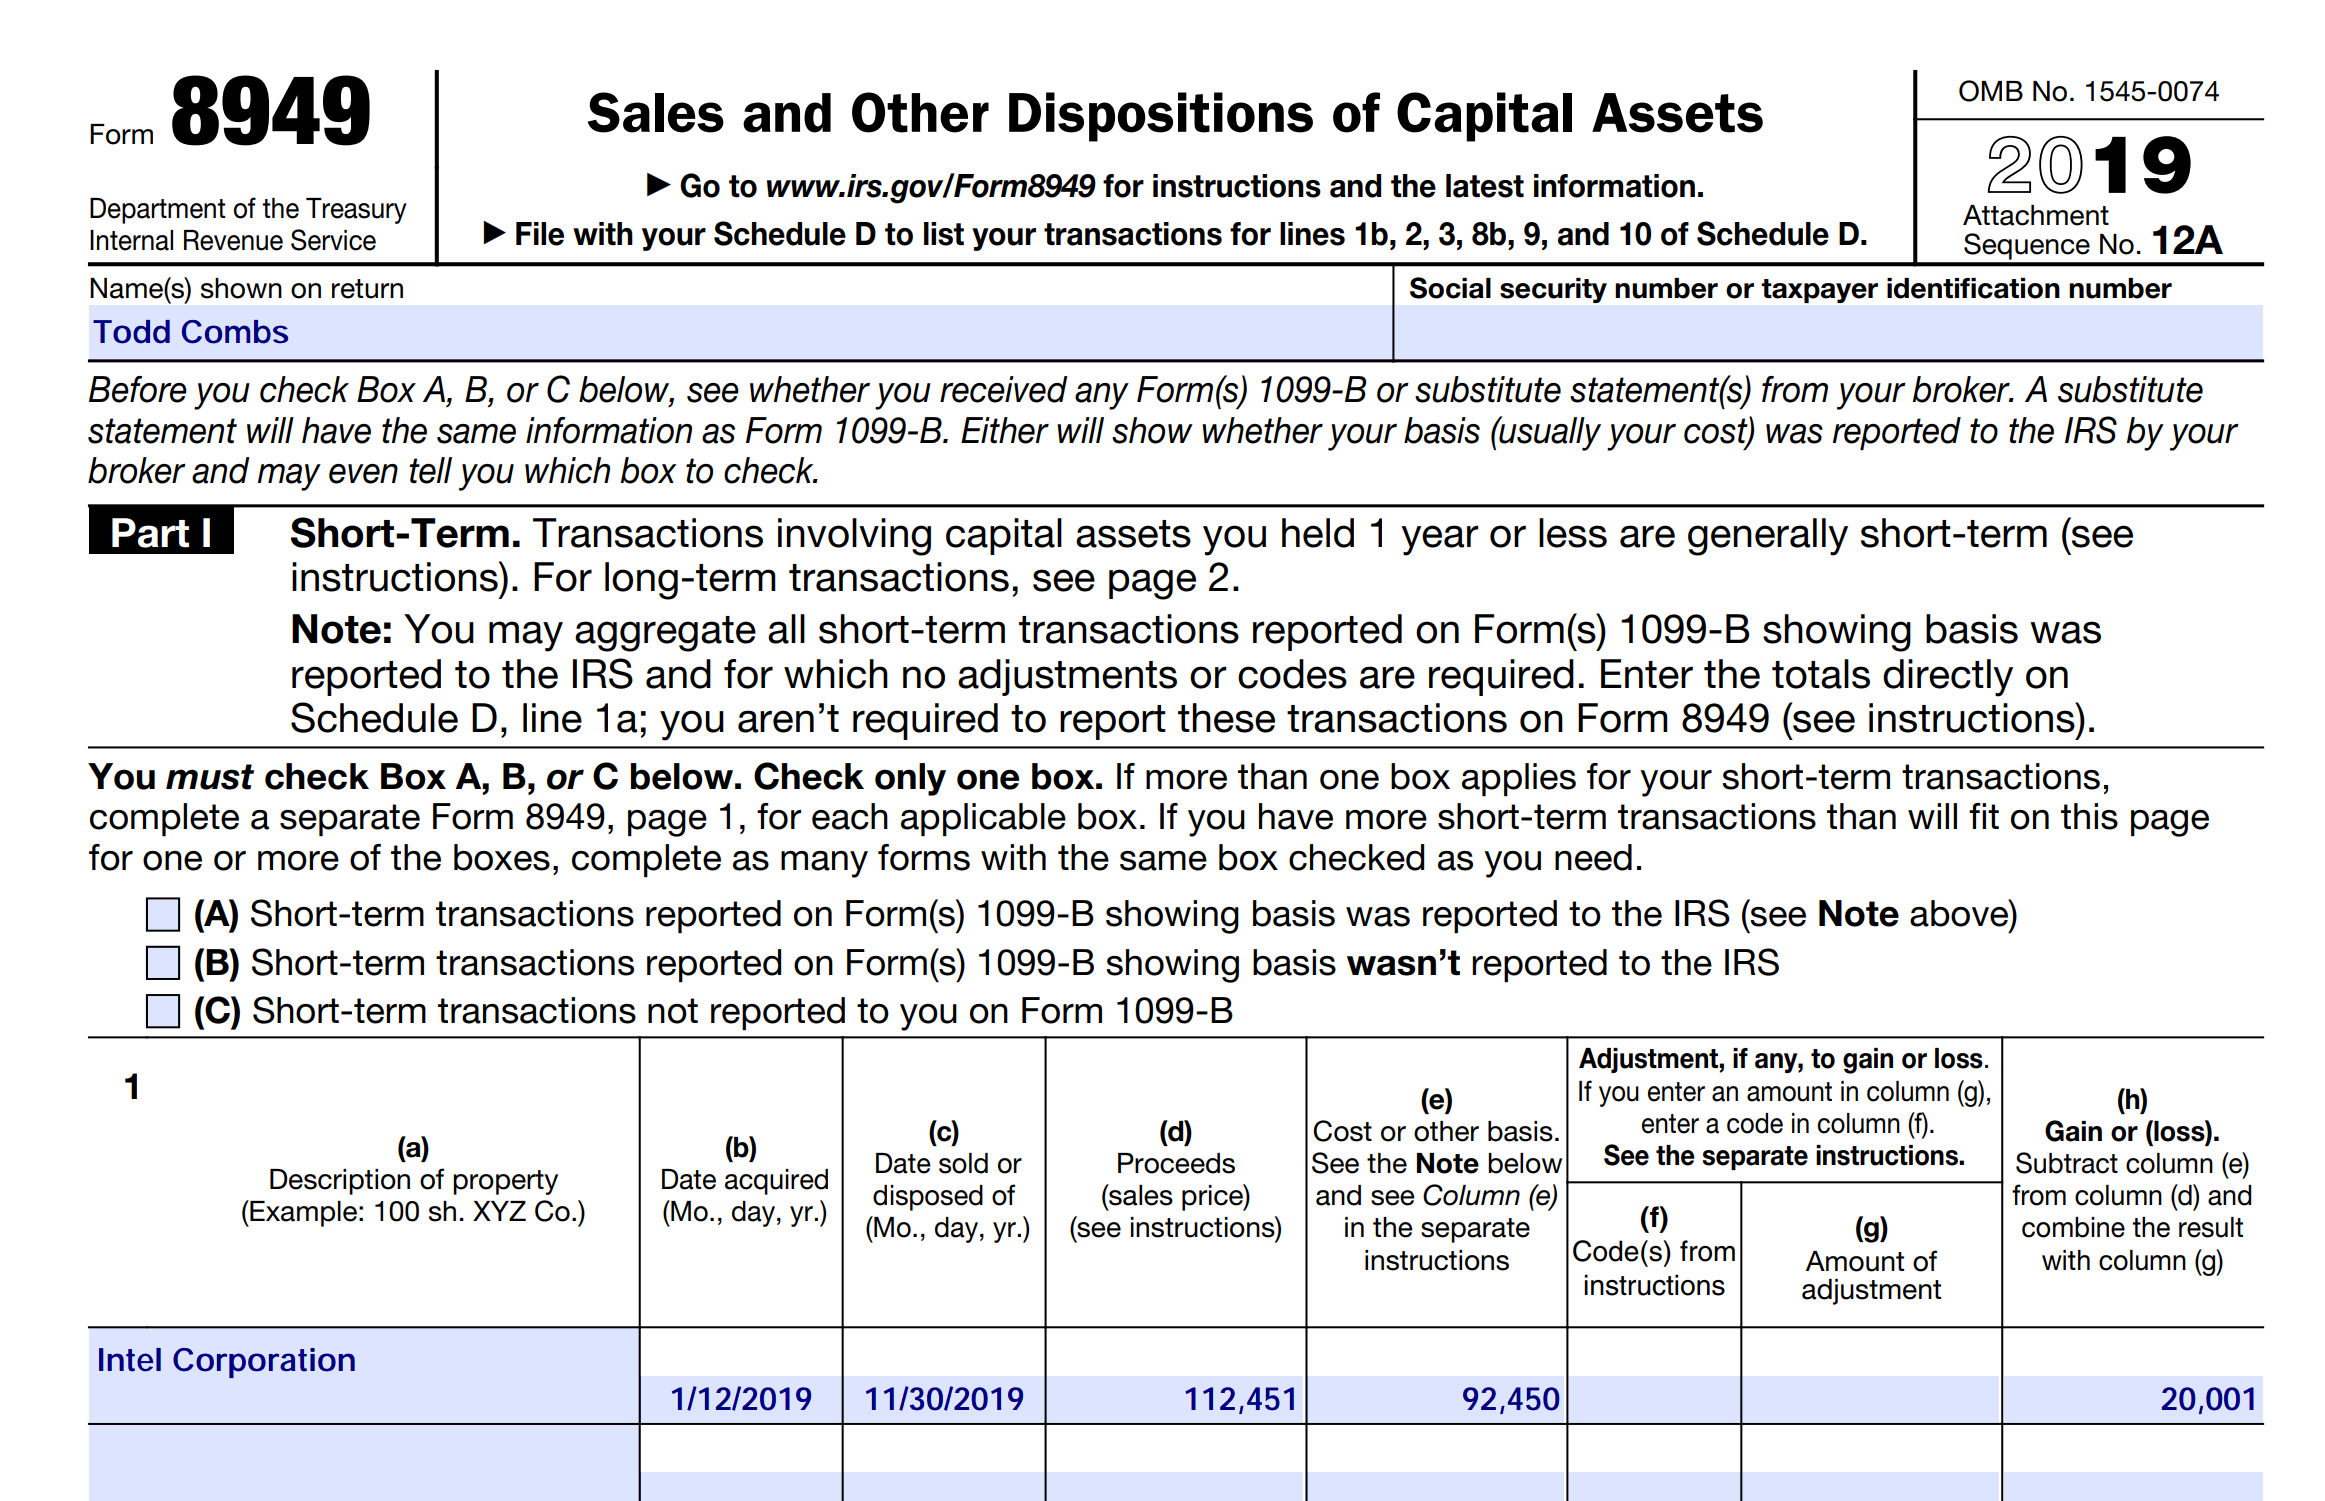
9. Generate IRS Tax Forms
If you sold investments, EquityStat can generate IRS Form 8949, which tax preparers use to calculate capital gains. Yahoo Finance does not offer this.
10. Export Your Data for Safekeeping
Download your transactions to a spreadsheet for backup or offline analysis.
11. 24/7 Support
Have a question? EquityStat’s support team is available 24 hours a day, 7 days a week.
12. Works on Any Device
Because EquityStat is built with modern web technology, you can access your portfolio on:
- Desktop
- Laptop
- Tablet
- Mobile phone
No plugins. No compatibility issues.