Google’s (GOOG/GOOGL) stock is scheduled to split on July 15, 2022. It is a 20 for 1 stock split. So, for each share you own before the split, you get 20 shares.
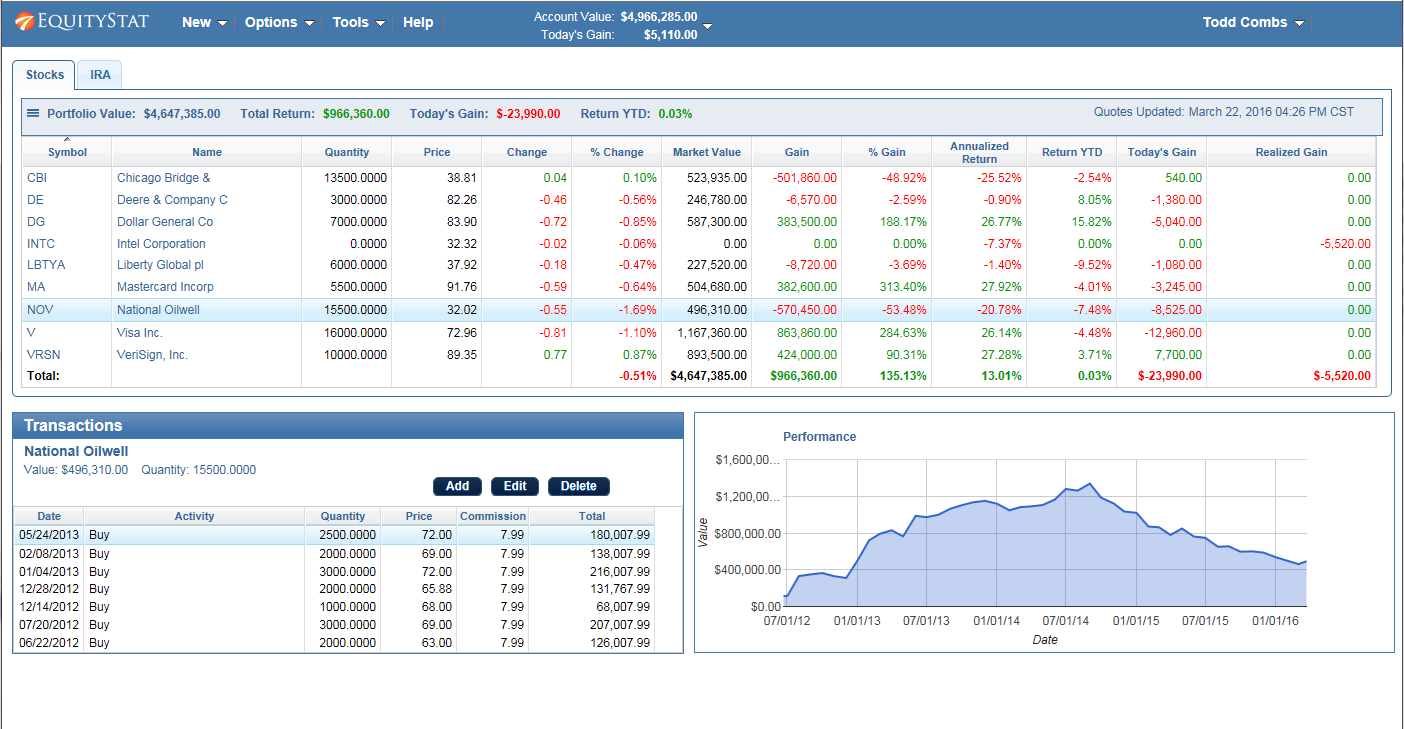
If you owned Google (GOOG/GOOGL) stock before the split and you are tracking this stock in your EquityStat portfolio, how do you record the split?
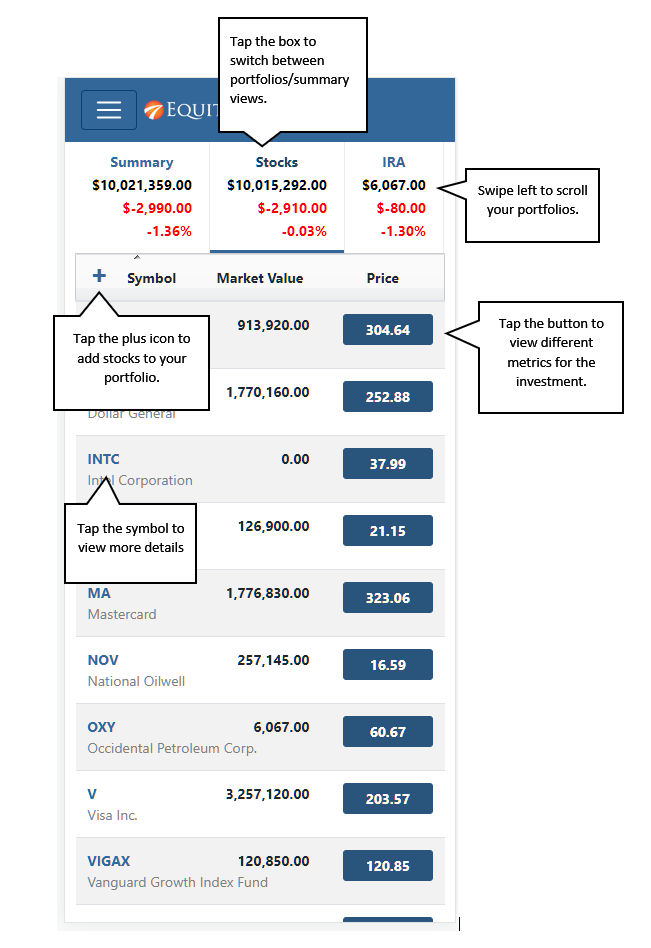
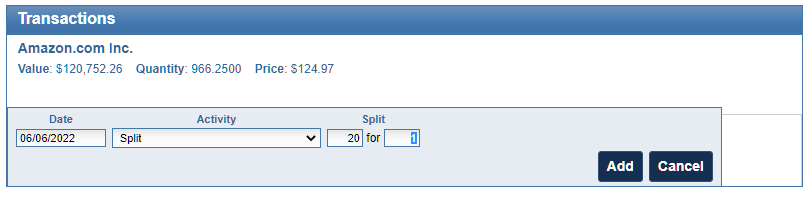
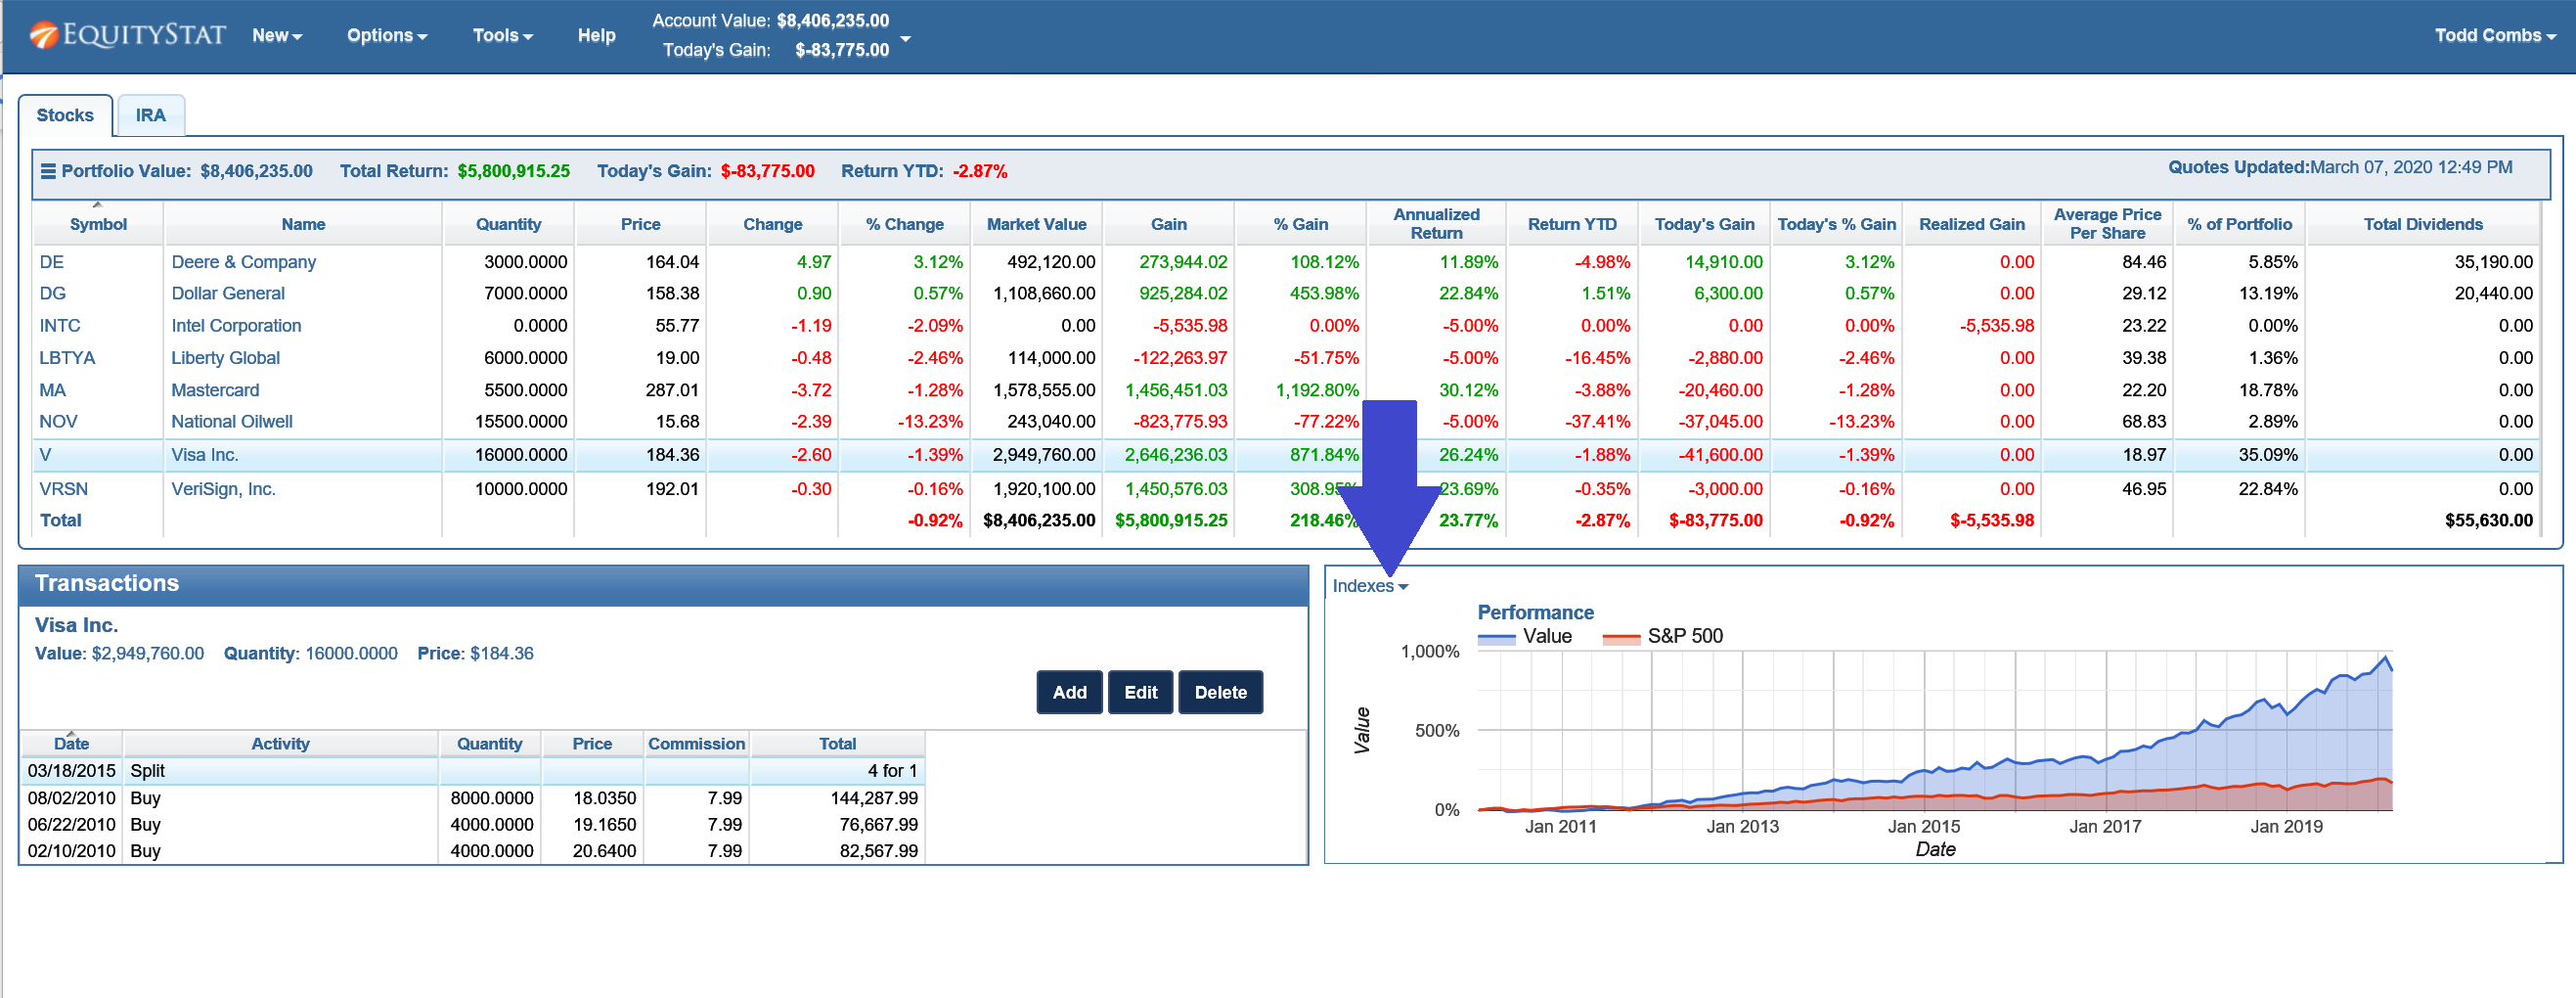
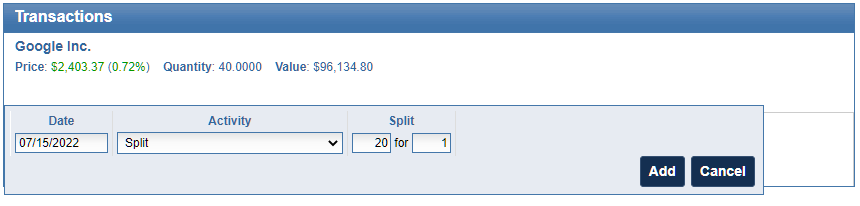
First, select the Google stock in your investment panel. Next, in the transaction panel, click the Add button to add a new transaction. In the Activity drop down, choose a “Split” transaction. Enter how many shares were split, in this case it is a 20 for 1 split, and click the Add button to save the transaction.
When the split transaction is saved, each transaction will be adjusted to reflect this split. The number of shares will be increased twenty times and the price will be divided by twenty.
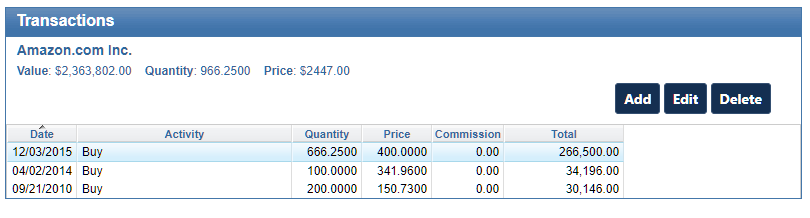
For example, if you had the following transactions before the split.
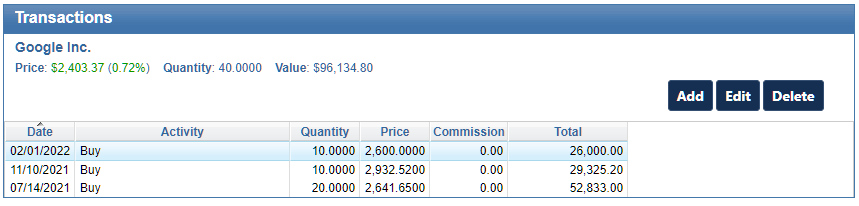
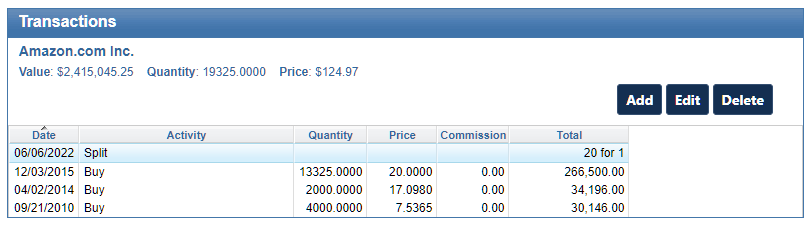
After the split your transactions will look like this.
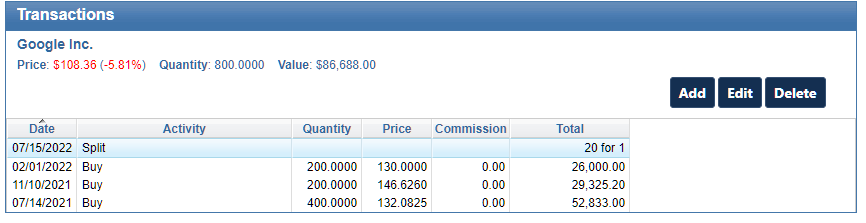
Notice that before the split there were three buy transactions. After the split, the number of shares has increased 20 times and the price has been reduced by a factor of twenty. For example, the initial buy on 7/14/2021 was for a quantity of 20 shares. After the split, the purchased quantity is 400 shares. The price the shares were bought on 7/14/2021 was $2641.65. After the split, the price paid was $132.08. These adjustments are all automatically done when you enter the split transaction.
If you have other stocks that have split, you can use the same steps to record your split. Just make sure that you enter the correct split information.