The stock market ended 2024 near record highs. The Nasdaq Composite rallied by 30%, while the S&P 500 climbed over 24%. The blue-chip Dow Jones rose a more modest 13%. The S&P 500 clinched 57 records, making it one of the top five years for most all-time highs recorded by the benchmark index.
Technology and Communications Services were the standout sectors, thanks to the artificial intelligence boom. Big Tech stocks, including Nvidia, Tesla, Alphabet, Amazon, Apple, Microsoft, and Meta, posted significant gains. Nvidia, in particular, rallied more than 175%
Here are the best performing stocks of 2024.
Here are the worst performing stocks of 2024.
You can read more about the best and worst performing stocks here and here.
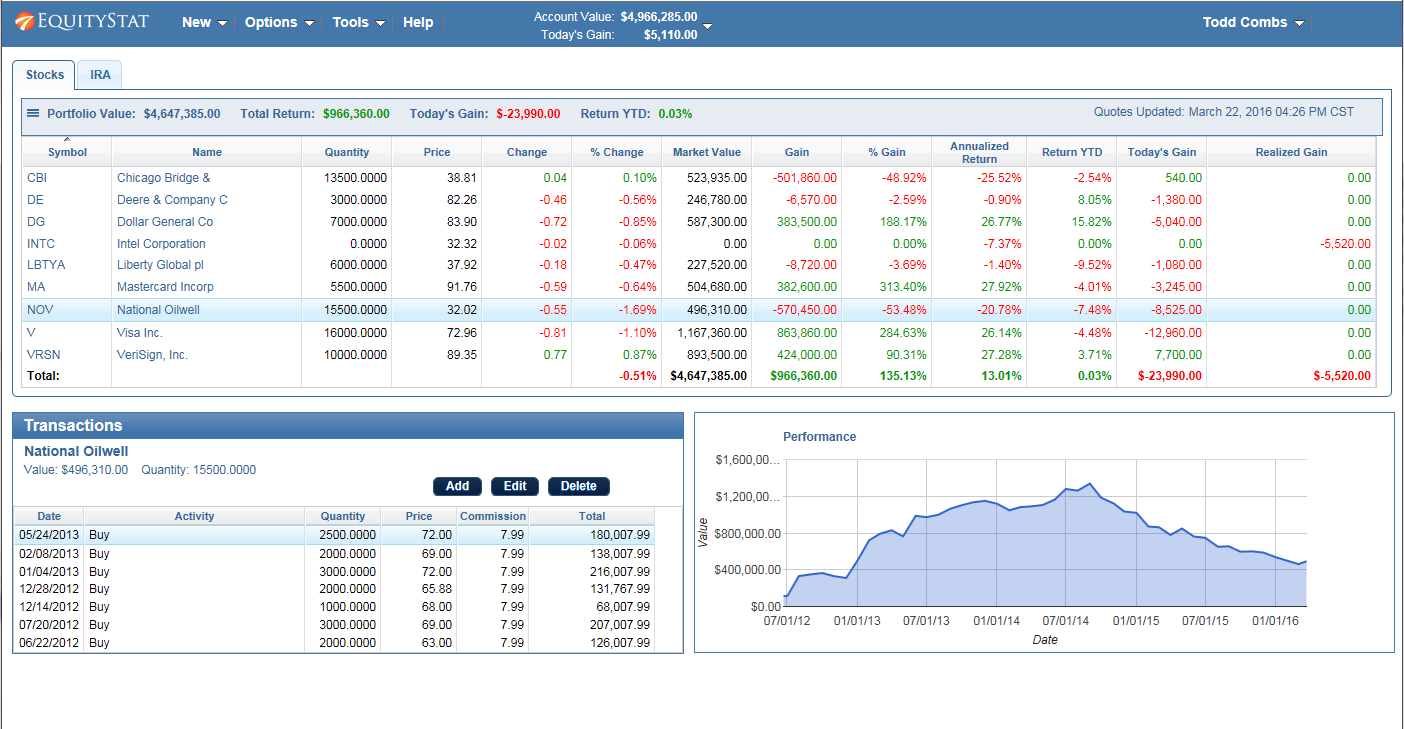
Note, if you want to share your portfolio in image format like you see above, go to here.
Kiplinger Magazine — one of the most respected names in personal finance — recently recognized EquityStat as one of the top tools for DIY stock investors. To build their list, Kiplinger consulted seasoned investors and long‑time Wall Street observers, selecting only platforms that deliver real value, clarity, and actionable insights.
Their verdict: EquityStat stands out as a powerful, easy‑to‑use portfolio tracking solution for everyday investors.
Why Kiplinger Highlighted EquityStat
In their review of top investing tools, Kiplinger emphasized several strengths that make EquityStat especially useful for self‑directed investors:
1. Fast, Simple Portfolio Setup
Kiplinger noted that EquityStat makes it incredibly easy to build a stock‑tracking portfolio. Investors can add holdings quickly, organize multiple portfolios, and start analyzing performance in minutes — without the clutter or complexity found in many other tools.
2. Robust Performance Metrics
According to Kiplinger’s analysis, EquityStat provides a wide range of performance indicators that help investors understand how their stocks, ETFs, and mutual funds are truly performing. These include:
Daily gain/loss
Total return
Annualized return
Realized gains
Cost basis
Long‑term performance trends
These metrics give DIY investors the clarity they need to make informed decisions.
3. Clean, Intuitive Interface
Kiplinger also praised EquityStat’s clean, streamlined design. The interface avoids unnecessary distractions and focuses on what matters most: clear data, easy navigation, and fast access to performance insights.
Why This Recognition Matters
Being named one of Kiplinger’s top tools reinforces what many investors already know: EquityStat is a reliable, transparent, and user‑friendly platform for tracking investments.
For individual investors — especially those managing their own portfolios without an advisor — having a tool that is both powerful and easy to use is essential. Kiplinger’s endorsement highlights EquityStat’s ability to deliver exactly that.
Tech Times recently named EquityStat its best investment portfolio management software. They recognize EquityStat as the top choice for investors seeking effective portfolio management software, with its advanced features and user-friendly interface positioning it as a valuable tool for optimizing investment performance.
Tech Times praises EquityStat for its real-time data capabilities, performance tracking, and personalized portfolio analysis. EquityStat is also recognized for its user-friendly interface, making it suitable for investors of all experience levels.
EquityStat’s mission to empower investors through data-driven investing was a key focal point, emphasizing how the platform enables users to gain control over their investments and make smarter choices. The article also highlights the user-friendly interface, making it accessible for both seasoned investors and those new to the stock market.
The article concludes by emphasizing how EquityStat has successfully simplified the process of managing tech investments, making it an invaluable tool for tech enthusiasts, investors, and professionals alike.
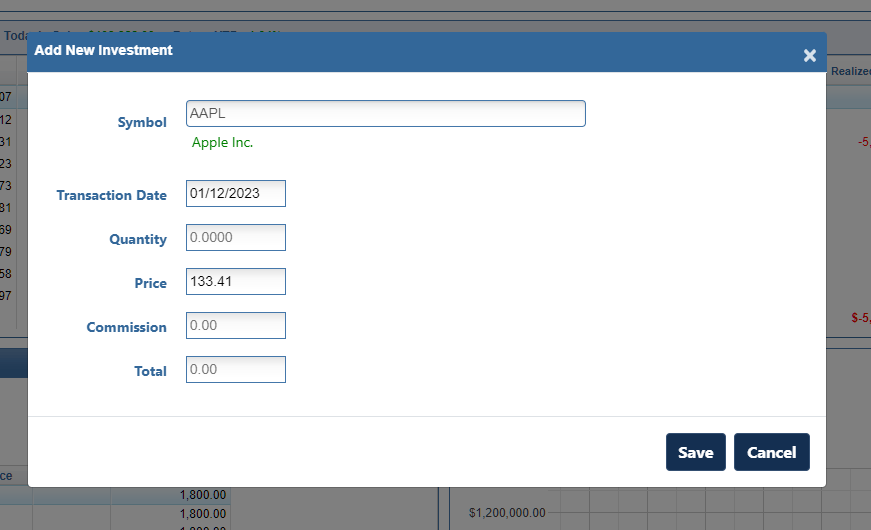
We have added a new feature to our Stock Portfolio Tracker application. When you enter a new stock/investment or add a new transaction for an existing stock/investment, the price of the investment is automatically displayed in the Price field. The price that is displayed is the closing or current price for the date of the transaction. If this price is not correct, you can override the price by entering the correct price.
This feature was designed in case you don’t know the exact price you purchased or sold a stock for, the price is automatically filled in for you and you don’t have to look it up. If you do know the exact price, you can override the filled in price with the correct price.
Example of Auto Price
For example, if your purchased Apple stock on January 12, 2023 the price of $134.56 will automatically be filled in since this was the closing price on January 12th. If you purchased Apple for a lower or higher price, you can edit the price to the correct price.
This feature also comes in handy when you want to see what price a stock was trading for a past date. Just select the stock, enter the date and you will see the price for that date.
We are pleased to announce that EquityStat has been named one of Dallas’ fastest growing Fintech companies. The companies on this list were selected based on their track record, executive leadership, market share and innovation.
We have recently refreshed the user interface of your EquityStat portfolio on mobile devices. The user interface now looks, feels and works like a mobile app. If you have ever used the Weather Channel App or the ESPN App on your mobile phone, EquityStat works very similar.
To view your EquityStat account on a mobile phone, open up the phone’s web browser, go to www.equitystat.com and login to your account.
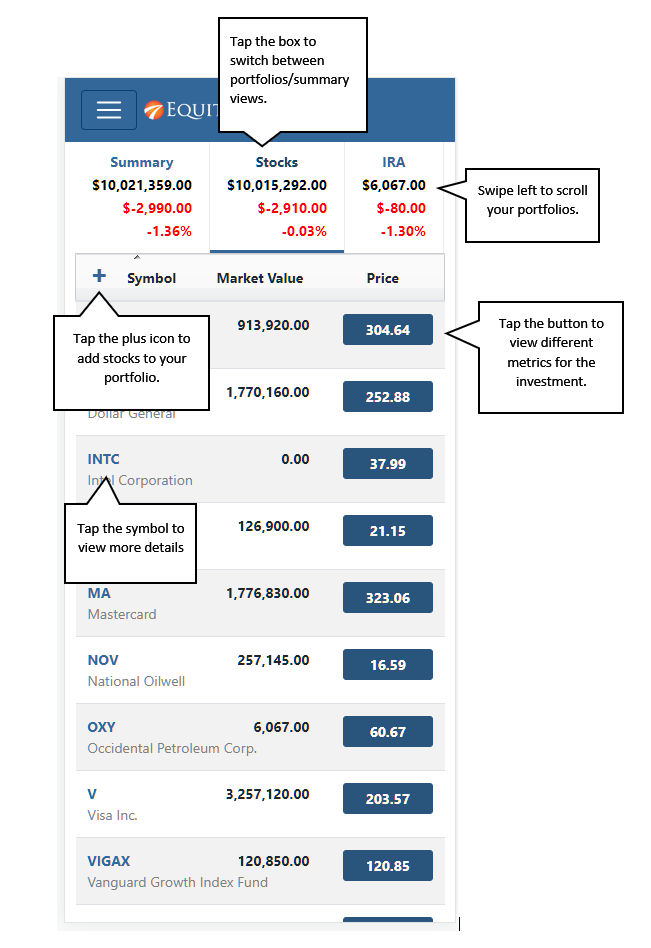
Example EquityStat Account on a Mobile Phone.
You will then see a list of all your portfolios at the top. You can swipe left at the top to scroll through all of your portfolios. Tap a “portfolio box” to see the investments in each portfolio.
To see details about a specific investment, tap the symbol for the investment. To view metrics about a specific investment tap the price button. Continue tapping the button to cycle through all of the investment metrics.
To add a new investment to your portfolio, tap the plus icon.
How did your investments do in 2017? What was your best stock? If you are not tracking your investment’s performance, consider using EquityStat. With EquityStat you can track the overall performance of your portfolio/account as well as the performance of each individual investment. EquityStat tracks the annualized return, year to date return, daily gain, overall gain and many other metrics of your investments. With these metrics you can easily determine what are your best investments.
Many online brokerages and mutual funds track an individual stock or mutual fund’s performance but you cannot get the overall return of all your stocks or mutual funds. With EquityStat not only can you get the return each investment, you can also get the return for your entire account. This way you know how well your investments are performing at any time.
Google Finance Is Discontinuing Its Portfolio Manager
Google has officially discontinued the Google Finance stock portfolio manager, leaving many investors searching for a reliable replacement. If you relied on Google Finance to track your stocks, ETFs, or mutual funds, EquityStat offers a powerful, easy‑to‑use alternative with many of the same features — and more.
Why EquityStat Is a Strong Replacement for Google Finance Portfolios
EquityStat provides a clean, intuitive interface designed for investors who want accurate performance tracking without complexity.
Key Features Comparable to Google Finance
View the total value of your portfolio
Track daily gain/loss
See percentage gain since purchase
Review realized gains
View annualized return for each investment
Track stocks, ETFs, and mutual funds
Access complete transaction history for each holding
EquityStat gives you the same visibility you had in Google Finance — plus deeper analytics.
Importing Your Google Finance Portfolio Into EquityStat
Transitioning from Google Finance is simple.
You can import your portfolio by:
Manually entering transactions, or
Uploading a spreadsheet with your historical data
If you need help, EquityStat’s support team can guide you through the process.
More Tools to Manage and Analyze Your Portfolio
EquityStat includes additional features that go beyond what Google Finance offered:
Create multiple portfolios
View performance graphs over time
Analyze portfolio holdings and allocation
Edit or delete transactions at any time
Track performance across all your investments in one place
These tools help you understand your portfolio’s performance with greater accuracy and detail.
Why Investors Choose EquityStat To Replace Google Finance
Simple, fast, and user‑friendly
Accurate performance calculations
Ideal for long‑term investors and active traders
Built specifically for stock, ETF, and mutual fund tracking
A dependable replacement for Google Finance’s discontinued portfolio manager
If you miss the old Google Finance portfolio tool, EquityStat is one of the best alternatives available today.
To begin, open your EquityStat account and navigate to the Tools menu located at the top of the screen. From the dropdown list, select Print Portfolio. This will take you to a dedicated printing page designed specifically for generating portfolio reports.
Choose What You Want to Print
On the print page, you’ll see options that let you decide exactly which portfolio—or portfolios—you want to include.
You can print a single portfolio if you only need information for one set of investments.
Or, if you manage several portfolios, you can choose to print all of them at once, making it easy to create a complete snapshot of your entire investment landscape.
This flexibility is especially helpful for users who track different strategies, accounts, or goals and want a consolidated view.
Generate a PDF
Print Portfolio Example
Once you’ve selected your portfolio(s), click the Print button. EquityStat will automatically generate a PDF file containing your portfolio details. From there, you can:
Print the PDF directly to your home or office printer
Save the file to your computer for record‑keeping
Email or share the PDF with advisors, accountants, or anyone else who needs access
The PDF format ensures your portfolio is neatly formatted, easy to read, and consistent every time you print it.
Enhancing EquityStat to Better Support Modern Investors
The addition of this print feature is just one example of how we continue to evolve EquityStat to meet the needs of modern investors. Many users rely on printed reports for meetings, tax preparation, long‑term planning, or simply for peace of mind. By offering a fast, reliable way to generate PDFs or hard copies of your portfolios, we aim to make your investment management experience smoother, more flexible, and better aligned with the way you prefer to work.
We are hearing from a lot of frustrated Yahoo Finance Portfolio users. The latest changes to “improve” the portfolio manager have actually made the product worse. If you are looking for an alternative to Yahoo Finance stock portfolio, we encourage you to take a look at EquityStat’s portfolio manager.
EquityStat was founded by investors. As investors we understand what other investors are looking for in a portfolio manager. For example, one of our goals was to make EquityStat’s Portfolio manager show as much information on your screen without you having to constantly scroll around to see your data. Unlike Yahoo, EquityStat does not show ads, so this gives us more room to show more information about your investments and how they are performing.
Stock Portfolio Example
You can learn more about the similarities and differences between Yahoo Finance’s portfolio manager and EquityStat’s portfolio manager here.
In addition if there is any feature that you liked in Yahoo Finance’s portfolio manager that is missing in EquityStat, let us know. We will seriously consider adding this feature as well as any other feature you might find useful. Our goal is to keep enhancing EquityStat to give our users the features and services they want!