Have you ever wanted to display what stocks you own on a webpage? Or maybe you want to show what stocks you recommend on an online investment forum? What about sharing your stock portfolio on X, Facebook or email?
With our new Share Portfolio feature you can do all of this.
To get started sharing your portfolio, click the Tools menu at the top and choose Share Portfolio from the drop down menu.
On the Share Portfolio page, choose the portfolio you want to share and click the Generate button. An image of your portfolio will then be generated. You can then link to this image on a website or social media post. You can also download the image and send the image in an email or also use the image file in a social media post.
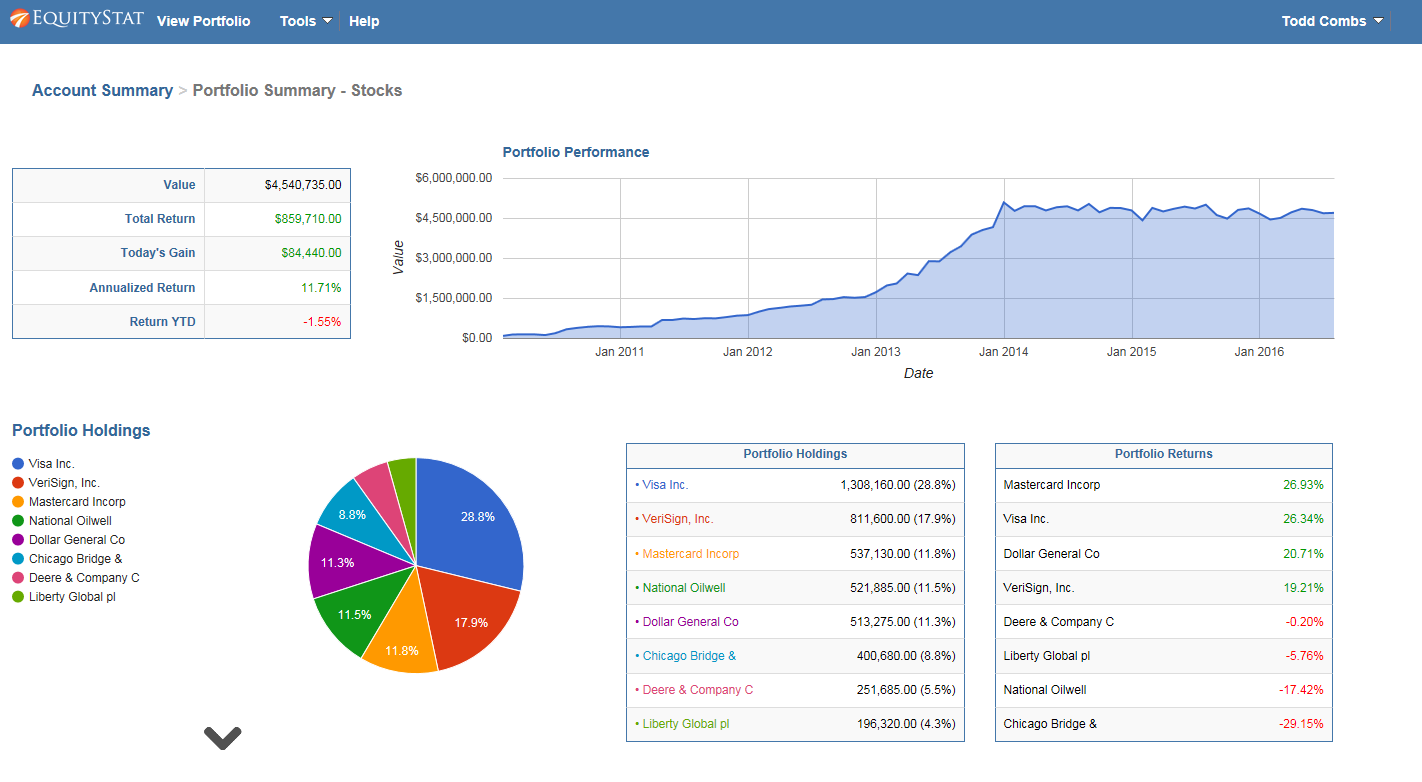
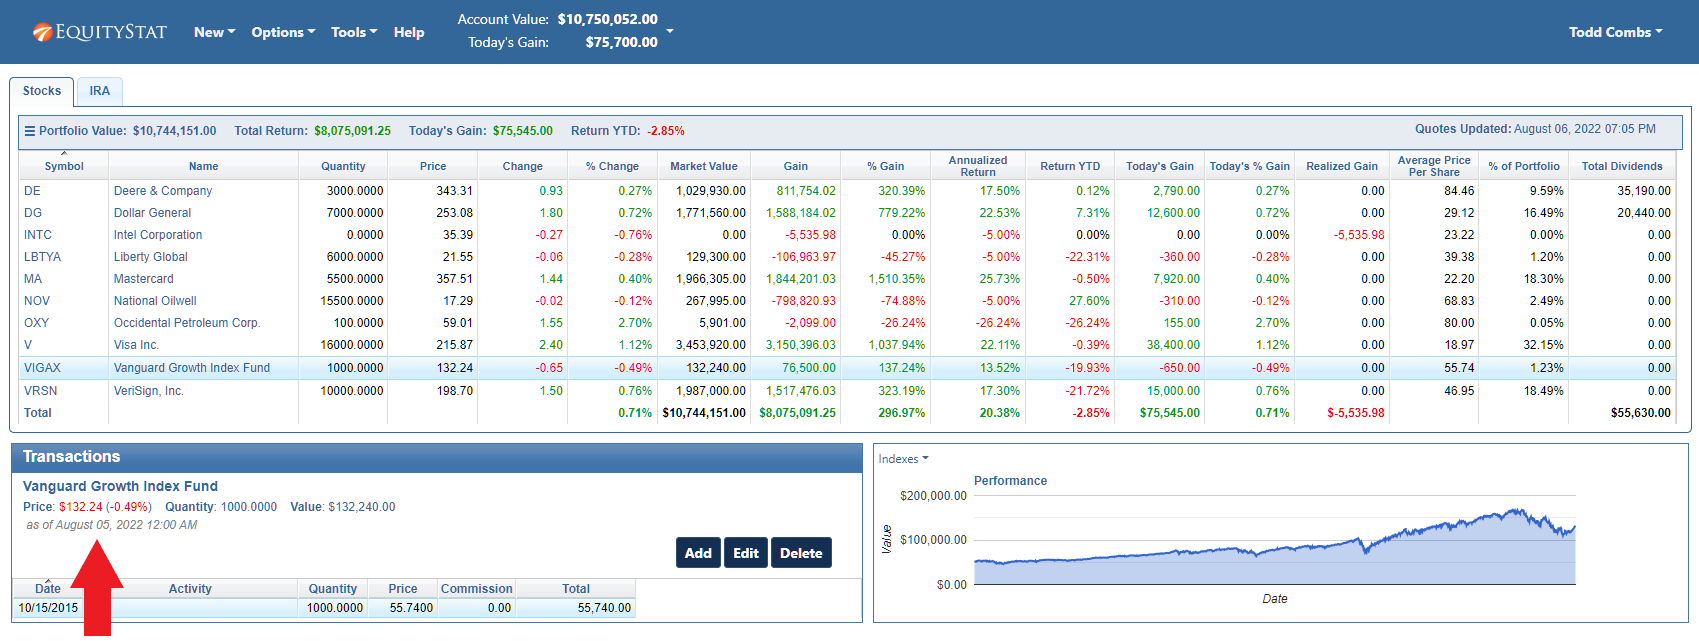
For example, here is an image of a portfolio for Berkshire Hathaway’s top stocks.
If you link to an image, the image will display the most recent prices for the stocks in your portfolio. If you share the image file, the prices will be the current price when the image was generated.
You can also choose what columns to display in the image by clicking the Select Columns link and then choosing the columns you want to display.